Costco 2010 Annual Report Download - page 34
Download and view the complete annual report
Please find page 34 of the 2010 Costco annual report below. You can navigate through the pages in the report by either clicking on the pages listed below, or by using the keyword search tool below to find specific information within the annual report.-
 1
1 -
2
-
3
-
4
-
5
-
6
-
7
-
8
-
9
-
10
-
11
-
12
-
13
-
14
-
15
-
16
-
17
-
18
-
19
-
20
-
21
-
22
-
23
-
 24
24 -
 25
25 -
 26
26 -
 27
27 -
 28
28 -
 29
29 -
 30
30 -
 31
31 -
 32
32 -
 33
33 -
 34
34 -
 35
35 -
 36
36 -
 37
37 -
 38
38 -
 39
39 -
 40
40 -
 41
41 -
 42
42 -
 43
43 -
 44
44 -
45
-
46
-
47
-
48
-
49
-
50
-
51
-
52
-
53
-
54
-
55
-
56
-
57
-
58
-
59
-
60
-
61
-
62
-
63
-
64
-
65
-
66
-
67
-
68
-
69
-
70
-
71
-
72
-
73
-
74
-
75
-
76
-
77
-
78
-
79
-
80
-
81
-
82
-
83
-
84
-
85
-
86
-
87
-
88
 |
 |

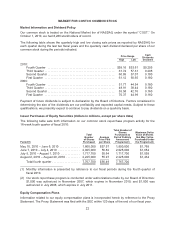
2010 vs. 2009
Net income for 2010 increased to $1,303, or $2.92 per diluted share, from $1,086, or $2.47 per diluted
share, during 2009, representing an 18% increase in diluted net income per share. As previously
discussed, foreign currencies, particularly in Canada, Korea and Japan, strengthened against the U.S.
dollar, which positively impacted net income for 2010 by approximately $61 after-tax, or $0.14 per
diluted share. Various factors, discussed in detail above (including sales, membership fees, gross
margin, and selling, general and administrative expenses), contributed to the increase in net income for
2010.
2009 vs. 2008
Net income for 2009 decreased to $1,086, or $2.47 per diluted share, from $1,283, or $2.89 per diluted
share, during 2008, representing a 15% decrease in diluted net income per share. As previously
discussed, foreign currencies, particularly in Canada, the United Kingdom and Korea, weakened
against the U.S. dollar, which negatively impacted net income for 2009 by approximately $83 after-tax,
or $0.19 per diluted share. Various factors, discussed in detail above (including sales, membership
fees, gross margin, and selling, general and administrative expenses), contributed to the decrease in
net income for 2009.
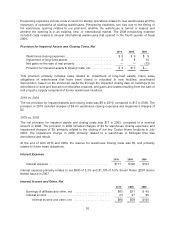
LIQUIDITY AND CAPITAL RESOURCES
The following table itemizes components of our most liquid assets at the end of 2010 and 2009 (dollars
in millions, except per share data):
2010 2009
Cash and cash equivalents .................................. $3,214 $3,157
Short-term investments ...................................... 1,535 570
Total ................................................. $4,749 $3,727
Our primary sources of liquidity are cash flows generated from warehouse operations and cash and
cash equivalents and short-term investment balances, which were $4,749 and $3,727 at the end of
2010 and 2009, respectively. Of these balances, approximately $862 and $758 at the end of 2010 and
2009, respectively, represented debit and credit card receivables, primarily related to sales in the week
prior to the end of our fiscal year.
Net cash provided by operating activities totaled $2,780 in 2010 compared to $2,092 in 2009. This net
increase of $688 was primarily attributable to a $371 decrease in our net investment in merchandise
inventories (merchandise inventories less accounts payable), an increase in net income of $224, and a
$141 increase from the change in our other current operating assets and liabilities.
Net cash used in investing activities totaled $2,015 in 2010 compared to $1,101 in 2009, an increase of
$914. This increase relates primarily to a $1,113 decrease in cash provided by the net investment in
short-term investments, partially offset by a $195 decrease in cash used for purchase of property and
equipment.
Net cash used in financing activities totaled $719 in 2010 compared to $439 in 2009, an increase of
$280. This increase was primarily attributable to a $482 increase in cash used to repurchase common
stock, a $78 increase in repayments of long-term debt and a $42 increase in dividends paid. These
were partially offset by a $124 increase in the net proceeds from stock-based awards and, a $116
increase in the net proceeds from short-term borrowings.
32