Boeing 2014 Annual Report Download - page 79
Download and view the complete annual report
Please find page 79 of the 2014 Boeing annual report below. You can navigate through the pages in the report by either clicking on the pages listed below, or by using the keyword search tool below to find specific information within the annual report.-
 1
1 -
2
-
3
-
4
-
5
-
6
-
7
-
8
-
9
-
10
-
11
-
12
-
13
-
14
-
15
-
16
-
17
-
18
-
19
-
20
-
21
-
22
-
23
-
24
-
25
-
26
-
27
-
28
-
29
-
30
-
31
-
32
-
33
-
34
-
35
-
36
-
37
-
38
-
39
-
40
-
41
-
42
-
43
-
44
-
45
-
46
-
47
-
48
-
49
-
50
-
51
-
52
-
53
-
54
-
55
-
56
-
57
-
58
-
59
-
60
-
61
-
62
-
63
-
64
-
65
-
66
-
67
-
68
-
 69
69 -
 70
70 -
 71
71 -
 72
72 -
 73
73 -
 74
74 -
 75
75 -
 76
76 -
 77
77 -
 78
78 -
 79
79 -
 80
80 -
 81
81 -
 82
82 -
 83
83 -
 84
84 -
 85
85 -
 86
86 -
 87
87 -
 88
88 -
 89
89 -
90
-
91
-
92
-
93
-
94
-
95
-
96
-
97
-
98
-
99
-
100
-
101
-
102
-
103
-
104
-
105
-
106
-
107
-
108
-
109
-
110
-
111
-
112
-
113
-
114
-
115
-
116
-
117
-
118
-
119
-
120
-
121
-
122
-
123
-
124
-
125
-
126
-
127
-
128
-
129
-
130
-
131
-
132
-
133
-
134
-
135
-
136
-
137
-
138
-
139
-
140
-
141
-
142
-
143
-
144
-
145
-
146
-
147
-
148
 |
 |

67
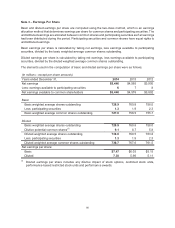
The following table includes the number of shares that may be dilutive potential common shares in the
future. These shares were not included in the computation of diluted earnings per share because the effect
was either antidilutive or the performance condition was not met.
(Shares in millions)
Years ended December 31, 2014 2013 2012
Stock options 4.8 23.6
Performance awards 5.1 4.2 4.9
Performance-based restricted stock units 1.3
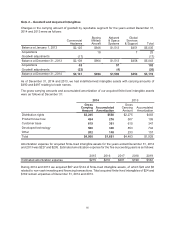
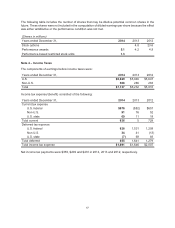
Note 4 – Income Taxes
The components of earnings before income taxes were:
Years ended December 31, 2014 2013 2012
U.S. $6,829 $5,946 $5,647
Non-U.S. 308 286 263
Total $7,137 $6,232 $5,910
Income tax expense/(benefit) consisted of the following:
Years ended December 31, 2014 2013 2012
Current tax expense
U.S. federal $676 ($82) $657
Non-U.S. 91 76 52
U.S. state 69 11 19
Total current 836 5 728
Deferred tax expense
U.S. federal 828 1,531 1,209
Non-U.S. 34 41 (13)
U.S. state (7) 69 83
Total deferred 855 1,641 1,279
Total income tax expense $1,691 $1,646 $2,007
Net income tax payments were $355, $209 and $410 in 2014, 2013 and 2012, respectively.