Boeing 2014 Annual Report Download - page 102
Download and view the complete annual report
Please find page 102 of the 2014 Boeing annual report below. You can navigate through the pages in the report by either clicking on the pages listed below, or by using the keyword search tool below to find specific information within the annual report.-
 1
1 -
2
-
3
-
4
-
5
-
6
-
7
-
8
-
9
-
10
-
11
-
12
-
13
-
14
-
15
-
16
-
17
-
18
-
19
-
20
-
21
-
22
-
23
-
24
-
25
-
26
-
27
-
28
-
29
-
30
-
31
-
32
-
33
-
34
-
35
-
36
-
37
-
38
-
39
-
40
-
41
-
42
-
43
-
44
-
45
-
46
-
47
-
48
-
49
-
50
-
51
-
52
-
53
-
54
-
55
-
56
-
57
-
58
-
59
-
60
-
61
-
62
-
63
-
64
-
65
-
66
-
67
-
68
-
69
-
70
-
71
-
72
-
73
-
74
-
75
-
76
-
77
-
78
-
79
-
80
-
81
-
82
-
83
-
84
-
85
-
86
-
87
-
88
-
89
-
90
-
91
-
 92
92 -
 93
93 -
 94
94 -
 95
95 -
 96
96 -
 97
97 -
 98
98 -
 99
99 -
 100
100 -
 101
101 -
 102
102 -
 103
103 -
 104
104 -
 105
105 -
 106
106 -
 107
107 -
 108
108 -
 109
109 -
 110
110 -
 111
111 -
 112
112 -
113
-
114
-
115
-
116
-
117
-
118
-
119
-
120
-
121
-
122
-
123
-
124
-
125
-
126
-
127
-
128
-
129
-
130
-
131
-
132
-
133
-
134
-
135
-
136
-
137
-
138
-
139
-
140
-
141
-
142
-
143
-
144
-
145
-
146
-
147
-
148
 |
 |

90
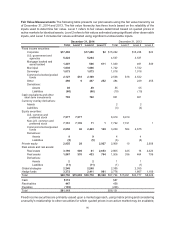
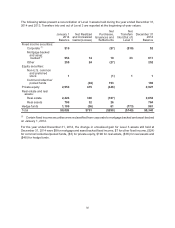
Fair Value Measurements The following table presents our plan assets using the fair value hierarchy as
of December 31, 2014 and 2013. The fair value hierarchy has three levels based on the reliability of the
inputs used to determine fair value. Level 1 refers to fair values determined based on quoted prices in
active markets for identical assets. Level 2 refers to fair values estimated using significant other observable
inputs, and Level 3 includes fair values estimated using significant unobservable inputs.
December 31, 2014 December 31, 2013
Total Level 1 Level 2 Level 3 Total Level 1 Level 2 Level 3
Fixed income securities:
Corporate $17,488 $17,486 $2 $15,262 $15,238 $24
U.S. government and
agencies 5,224 5,224 4,537 4,537
Mortgage backed and
asset backed 1,207 596 611 1,040 491 549
Municipal 1,636 1,636 1,722 1,722
Sovereign 1,073 1,073 1,018 1,018
Common/collective/pooled
funds 2,127 $18 2,109 2,538 $16 2,522
Other 498 9 237 252 484 229 255
Derivatives:
Assets 49 49 55 55
Liabilities (66) (66) (10) (10)
Cash equivalents and other
short-term investments 792 792 801 801
Currency overlay derivatives:
Assets 2 2
Liabilities (3) (3)
Equity securities:
U.S. common and
preferred stock 7,577 7,577 6,919 6,919
Non-U.S. common and
preferred stock 7,151 7,139 11 1 7,722 7,721 1
Common/collective/pooled
funds 2,658 46 2,443 169 3,239 564 2,675
Derivatives:
Assets 9944
Liabilities (5) (5) (6) (6)
Private equity 2,955 28 2,927 2,968 10 2,958
Real estate and real assets:
Real estate 3,199 505 41 2,653 2,865 425 16 2,424
Real assets 1,567 370 433 764 1,506 336 464 706
Derivatives:
Assets 2211
Liabilities (11) (11) (1) (1)
Global strategies 2,248 2,248 2,355 2,355
Hedge funds 3,372 2,411 961 2,776 1,667 1,109
Total $60,750 $15,692 $36,718 $8,340 $57,794 $15,991 $33,777 $8,026
Cash $115 $87
Receivables 447 458
Payables (193) (208)
Total $61,119 $58,131
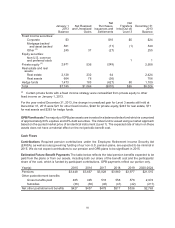
Fixed income securities are primarily valued upon a market approach, using matrix pricing and considering
a security’s relationship to other securities for which quoted prices in an active market may be available,