Boeing 2014 Annual Report Download - page 105
Download and view the complete annual report
Please find page 105 of the 2014 Boeing annual report below. You can navigate through the pages in the report by either clicking on the pages listed below, or by using the keyword search tool below to find specific information within the annual report.-
 1
1 -
2
-
3
-
4
-
5
-
6
-
7
-
8
-
9
-
10
-
11
-
12
-
13
-
14
-
15
-
16
-
17
-
18
-
19
-
20
-
21
-
22
-
23
-
24
-
25
-
26
-
27
-
28
-
29
-
30
-
31
-
32
-
33
-
34
-
35
-
36
-
37
-
38
-
39
-
40
-
41
-
42
-
43
-
44
-
45
-
46
-
47
-
48
-
49
-
50
-
51
-
52
-
53
-
54
-
55
-
56
-
57
-
58
-
59
-
60
-
61
-
62
-
63
-
64
-
65
-
66
-
67
-
68
-
69
-
70
-
71
-
72
-
73
-
74
-
75
-
76
-
77
-
78
-
79
-
80
-
81
-
82
-
83
-
84
-
85
-
86
-
87
-
88
-
89
-
90
-
91
-
92
-
93
-
94
-
 95
95 -
 96
96 -
 97
97 -
 98
98 -
 99
99 -
 100
100 -
 101
101 -
 102
102 -
 103
103 -
 104
104 -
 105
105 -
 106
106 -
 107
107 -
 108
108 -
 109
109 -
 110
110 -
 111
111 -
 112
112 -
 113
113 -
 114
114 -
 115
115 -
116
-
117
-
118
-
119
-
120
-
121
-
122
-
123
-
124
-
125
-
126
-
127
-
128
-
129
-
130
-
131
-
132
-
133
-
134
-
135
-
136
-
137
-
138
-
139
-
140
-
141
-
142
-
143
-
144
-
145
-
146
-
147
-
148
 |
 |

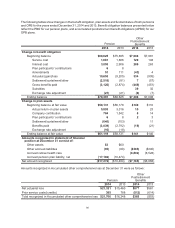
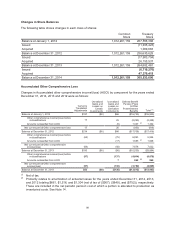
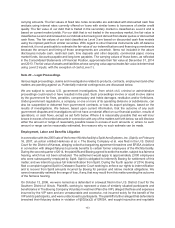
93
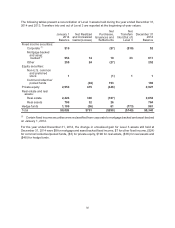
January 1
2013
Balance
Net Realized
and Unrealized
Gains
Net
Purchases,
Issuances and
Settlements
Net
Transfers
Into/(Out of)
Level 3
December 31
2013
Balance
Fixed income securities:
Corporate $3 $16 $5 $24
Mortgage backed
and asset backed 561 (11) (1) 549
Other (2) 245 37 (27) 255
Equity securities:
Non-U.S. common
and preferred stock 11
Private equity (2) 2,671 536 (249) 2,958
Real estate and real
assets:
Real estate 2,128 232 64 2,424
Real assets 664 78 (36) 706
Hedge funds 1,473 183 (627) 80 1,109
Total $7,745 $1,066 ($870) $85 $8,026
(2) Certain private funds with a fixed income strategy were reclassified from private equity to other
fixed income on January 1, 2013.
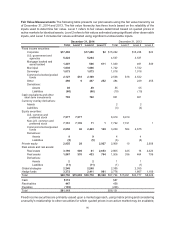
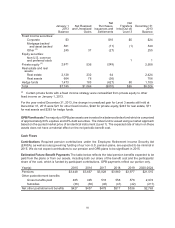
For the year ended December 31, 2013, the change in unrealized gain for Level 3 assets still held at
December 31, 2013 were $21 for other fixed income, $422 for private equity, $243 for real estate, $71
for real assets and $283 for hedge funds.
OPB Plan Assets The majority of OPB plan assets are invested in a balanced index fund which is comprised
of approximately 60% equities and 40% debt securities. The index fund is valued using a market approach
based on the quoted market price of an identical instrument (Level 1). The expected rate of return on these
assets does not have a material effect on the net periodic benefit cost.
Cash Flows
Contributions Required pension contributions under the Employee Retirement Income Security Act
(ERISA), as well as rules governing funding of our non-U.S. pension plans, are expected to be minimal in
2015. We do not expect contributions to our pension and OPB plans to be significant in 2015.
Estimated Future Benefit Payments The table below reflects the total pension benefits expected to be
paid from the plans or from our assets, including both our share of the benefit cost and the participants’
share of the cost, which is funded by participant contributions. OPB payments reflect our portion only.
Year(s) 2015 2016 2017 2018 2019 2020-2024
Pensions $3,448 $3,657 $3,828 $3,960 $3,977 $21,515
Other postretirement benefits:
Gross benefits paid 465 495 518 558 578 2,974
Subsidies (38)(38) (40) (41) (42) (211)
Net other postretirement benefits $427 $457 $478 $517 $536 $2,763