Boeing 2014 Annual Report Download - page 35
Download and view the complete annual report
Please find page 35 of the 2014 Boeing annual report below. You can navigate through the pages in the report by either clicking on the pages listed below, or by using the keyword search tool below to find specific information within the annual report.-
 1
1 -
2
-
3
-
4
-
5
-
6
-
7
-
8
-
9
-
10
-
11
-
12
-
13
-
14
-
15
-
16
-
17
-
18
-
19
-
20
-
21
-
22
-
23
-
24
-
 25
25 -
 26
26 -
 27
27 -
 28
28 -
 29
29 -
 30
30 -
 31
31 -
 32
32 -
 33
33 -
 34
34 -
 35
35 -
 36
36 -
 37
37 -
 38
38 -
 39
39 -
 40
40 -
 41
41 -
 42
42 -
 43
43 -
 44
44 -
 45
45 -
46
-
47
-
48
-
49
-
50
-
51
-
52
-
53
-
54
-
55
-
56
-
57
-
58
-
59
-
60
-
61
-
62
-
63
-
64
-
65
-
66
-
67
-
68
-
69
-
70
-
71
-
72
-
73
-
74
-
75
-
76
-
77
-
78
-
79
-
80
-
81
-
82
-
83
-
84
-
85
-
86
-
87
-
88
-
89
-
90
-
91
-
92
-
93
-
94
-
95
-
96
-
97
-
98
-
99
-
100
-
101
-
102
-
103
-
104
-
105
-
106
-
107
-
108
-
109
-
110
-
111
-
112
-
113
-
114
-
115
-
116
-
117
-
118
-
119
-
120
-
121
-
122
-
123
-
124
-
125
-
126
-
127
-
128
-
129
-
130
-
131
-
132
-
133
-
134
-
135
-
136
-
137
-
138
-
139
-
140
-
141
-
142
-
143
-
144
-
145
-
146
-
147
-
148
 |
 |

23
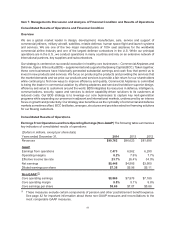
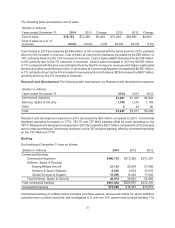
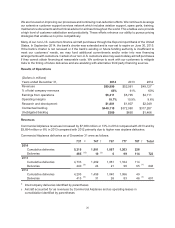
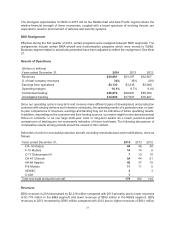
The following table summarizes cost of sales:
(Dollars in millions)
Years ended December 31, 2014 2013 Change 2013 2012 Change
Cost of sales $76,752 $73,268 $3,484 $73,268 $68,665 $4,603
Cost of sales as a % of
revenues 84.6% 84.6% 0.0% 84.6% 84.0% 0.6%
Cost of sales in 2014 increased by $3,484 million, or 5% compared with the same period in 2013, primarily
driven by the increase in revenue. Cost of sales at Commercial Airplanes increased by $6,265 million, or
14%, primarily driven by the 13% increase in revenues. Cost of sales at BDS decreased by $2,085 million,
or 8% primarily due to the 7% reduction in revenues. Cost of sales increased in 2013 by $4,603 million,
or 7% compared with the prior year primarily driven by the 6% increase in revenues and higher unallocated
pension and other postretirement costs. Cost of sales at Commercial Airplanes increased by $2,957 million,
or 7%, primarily driven by the 8% increase in revenues and cost of sales at BDS increased by $407 million,
primarily driven by the 2% increase in revenues.
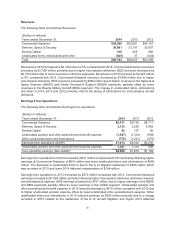
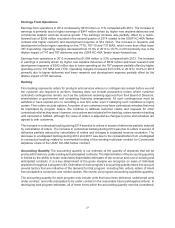
Research and Development The following table summarizes our Research and development expense:
(Dollars in millions)
Years ended December 31, 2014 2013 2012
Commercial Airplanes $1,881 $1,807 $2,049
Defense, Space & Security 1,158 1,215 1,189
Other 849 60
Total $3,047 $3,071 $3,298
Research and development expense in 2014 decreased by $24 million compared to 2013. Commercial
Airplanes spending increased on 777X, 787-10 and 737 MAX partially offset by lower spending on the
787-9. Research and development expense in 2013 decreased by $227 million compared to 2012 primarily
due to lower spending at Commercial Airplanes on the 787 program partially offset by increased spending
on the 737 MAX and 777X.
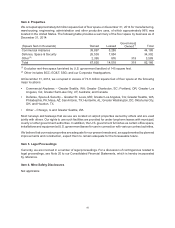
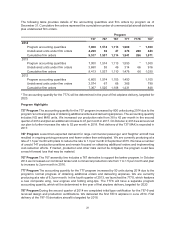
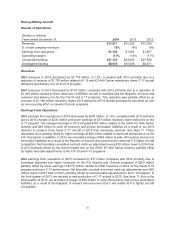
Backlog
Our backlog at December 31 was as follows:
(Dollars in millions) 2014 2013 2012
Contractual Backlog:
Commercial Airplanes $440,118 $372,980 $317,287
Defense, Space & Security:
Boeing Military Aircraft 21,143 23,604 27,898
Network & Space Systems 8,935 9,832 10,078
Global Services & Support 16,896 16,245 17,092
Total Defense, Space & Security 46,974 49,681 55,068
Total contractual backlog $487,092 $422,661 $372,355
Unobligated backlog $15,299 $18,267 $17,873
Contractual backlog of unfilled orders excludes purchase options, announced orders for which definitive
contracts have not been executed, and unobligated U.S. and non-U.S. government contract funding. The