Boeing 2014 Annual Report Download - page 60
Download and view the complete annual report
Please find page 60 of the 2014 Boeing annual report below. You can navigate through the pages in the report by either clicking on the pages listed below, or by using the keyword search tool below to find specific information within the annual report.-
 1
1 -
2
-
3
-
4
-
5
-
6
-
7
-
8
-
9
-
10
-
11
-
12
-
13
-
14
-
15
-
16
-
17
-
18
-
19
-
20
-
21
-
22
-
23
-
24
-
25
-
26
-
27
-
28
-
29
-
30
-
31
-
32
-
33
-
34
-
35
-
36
-
37
-
38
-
39
-
40
-
41
-
42
-
43
-
44
-
45
-
46
-
47
-
48
-
49
-
 50
50 -
 51
51 -
 52
52 -
 53
53 -
 54
54 -
 55
55 -
 56
56 -
 57
57 -
 58
58 -
 59
59 -
 60
60 -
 61
61 -
 62
62 -
 63
63 -
 64
64 -
 65
65 -
 66
66 -
 67
67 -
 68
68 -
 69
69 -
 70
70 -
71
-
72
-
73
-
74
-
75
-
76
-
77
-
78
-
79
-
80
-
81
-
82
-
83
-
84
-
85
-
86
-
87
-
88
-
89
-
90
-
91
-
92
-
93
-
94
-
95
-
96
-
97
-
98
-
99
-
100
-
101
-
102
-
103
-
104
-
105
-
106
-
107
-
108
-
109
-
110
-
111
-
112
-
113
-
114
-
115
-
116
-
117
-
118
-
119
-
120
-
121
-
122
-
123
-
124
-
125
-
126
-
127
-
128
-
129
-
130
-
131
-
132
-
133
-
134
-
135
-
136
-
137
-
138
-
139
-
140
-
141
-
142
-
143
-
144
-
145
-
146
-
147
-
148
 |
 |

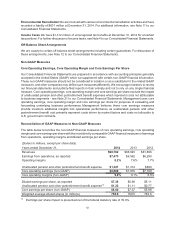
48
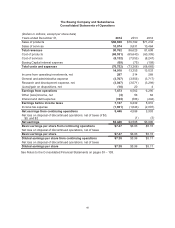
The Boeing Company and Subsidiaries
Consolidated Statements of Operations
(Dollars in millions, except per share data)
Years ended December 31, 2014 2013 2012
Sales of products $80,688 $76,792 $71,234
Sales of services 10,074 9,831 10,464
Total revenues 90,762 86,623 81,698
Cost of products (68,551) (65,640) (60,309)
Cost of services (8,132) (7,553) (8,247)
Boeing Capital interest expense (69) (75) (109)
Total costs and expenses (76,752) (73,268) (68,665)
14,010 13,355 13,033
Income from operating investments, net 287 214 268
General and administrative expense (3,767) (3,956) (3,717)
Research and development expense, net (3,047) (3,071) (3,298)
(Loss)/gain on dispositions, net (10) 20 4
Earnings from operations 7,473 6,562 6,290
Other (loss)/income, net (3) 56 62
Interest and debt expense (333) (386) (442)
Earnings before income taxes 7,137 6,232 5,910
Income tax expense (1,691) (1,646) (2,007)
Net earnings from continuing operations 5,446 4,586 3,903
Net loss on disposal of discontinued operations, net of taxes of $0,
$0, and $2 (1) (3)
Net earnings $5,446 $4,585 $3,900
Basic earnings per share from continuing operations $7.47 $6.03 $5.15
Net loss on disposal of discontinued operations, net of taxes
Basic earnings per share $7.47 $6.03 $5.15
Diluted earnings per share from continuing operations $7.38 $5.96 $5.11
Net loss on disposal of discontinued operations, net of taxes
Diluted earnings per share $7.38 $5.96 $5.11
See Notes to the Consolidated Financial Statements on pages 53 – 108.