Boeing 2014 Annual Report Download - page 46
Download and view the complete annual report
Please find page 46 of the 2014 Boeing annual report below. You can navigate through the pages in the report by either clicking on the pages listed below, or by using the keyword search tool below to find specific information within the annual report.-
 1
1 -
2
-
3
-
4
-
5
-
6
-
7
-
8
-
9
-
10
-
11
-
12
-
13
-
14
-
15
-
16
-
17
-
18
-
19
-
20
-
21
-
22
-
23
-
24
-
25
-
26
-
27
-
28
-
29
-
30
-
31
-
32
-
33
-
34
-
35
-
 36
36 -
 37
37 -
 38
38 -
 39
39 -
 40
40 -
 41
41 -
 42
42 -
 43
43 -
 44
44 -
 45
45 -
 46
46 -
 47
47 -
 48
48 -
 49
49 -
 50
50 -
 51
51 -
 52
52 -
 53
53 -
 54
54 -
 55
55 -
 56
56 -
57
-
58
-
59
-
60
-
61
-
62
-
63
-
64
-
65
-
66
-
67
-
68
-
69
-
70
-
71
-
72
-
73
-
74
-
75
-
76
-
77
-
78
-
79
-
80
-
81
-
82
-
83
-
84
-
85
-
86
-
87
-
88
-
89
-
90
-
91
-
92
-
93
-
94
-
95
-
96
-
97
-
98
-
99
-
100
-
101
-
102
-
103
-
104
-
105
-
106
-
107
-
108
-
109
-
110
-
111
-
112
-
113
-
114
-
115
-
116
-
117
-
118
-
119
-
120
-
121
-
122
-
123
-
124
-
125
-
126
-
127
-
128
-
129
-
130
-
131
-
132
-
133
-
134
-
135
-
136
-
137
-
138
-
139
-
140
-
141
-
142
-
143
-
144
-
145
-
146
-
147
-
148
 |
 |

34
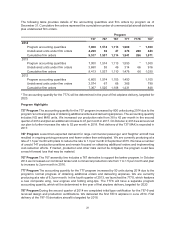
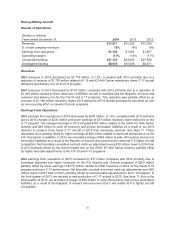
Backlog
BMA total backlog at December 31, 2014 was $29,173 million, a decrease of 13% reflecting revenue
recognized on contracts awarded in prior years, partially offset by contract awards for the F/A-18, P-8 and
Apache programs. BMA total backlog was $33,662 million at December 31, 2013, reflecting a decrease
of 8% from December 31, 2012 primarily due to revenues recognized on F-15, F/A-18 and C-17 program
contracts awarded in prior years, partially offset by CH-47 Chinook and V-22 Osprey multi-year contract
awards.
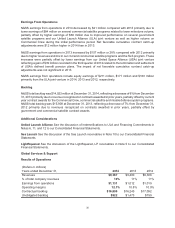
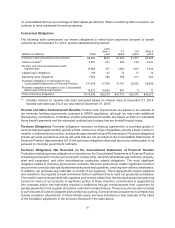
Additional Considerations
C-17 and F/A-18 See the discussion of the C-17 and F/A-18 programs in Note 11 to our Consolidated
Financial Statements.
KC-46A Tanker See the discussion of the KC-46A Tanker program on page 24.
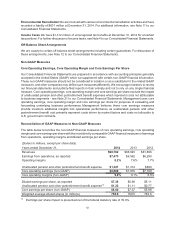
Network & Space Systems
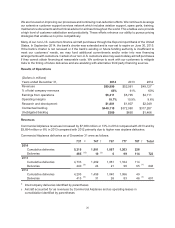
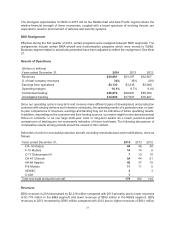
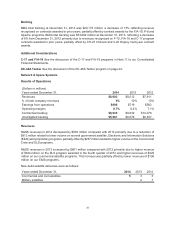
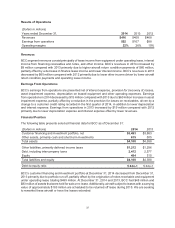
Results of Operations
(Dollars in millions)
Years ended December 31, 2014 2013 2012
Revenues $8,003 $8,512 $7,911
% of total company revenues 9% 10% 10%
Earnings from operations $698 $719 $562
Operating margins 8.7% 8.4% 7.1%
Contractual backlog $8,935 $9,832 $10,078
Unobligated backlog $5,987 $6,076 $6,937
Revenues
N&SS revenues in 2014 decreased by $509 million compared with 2013 primarily due to a reduction of
$812 million related to lower volume on several government satellite, Electronic and Information Solutions
(E&IS) and proprietary programs, partially offset by $257 million related to higher volume on the Commercial
Crew and SLS programs.
N&SS revenues in 2013 increased by $601 million compared with 2012 primarily due to higher revenue
of $364 million on the SLS program awarded in the fourth quarter of 2012 and higher revenues of $329
million on our commercial satellite programs. This increase was partially offset by lower revenues of $196
million on our E&IS programs.
New-build satellite deliveries were as follows:
Years ended December 31, 2014 2013 2012
Commercial and civil satellites 533
Military satellites 47