Boeing 2014 Annual Report Download - page 64
Download and view the complete annual report
Please find page 64 of the 2014 Boeing annual report below. You can navigate through the pages in the report by either clicking on the pages listed below, or by using the keyword search tool below to find specific information within the annual report.-
 1
1 -
2
-
3
-
4
-
5
-
6
-
7
-
8
-
9
-
10
-
11
-
12
-
13
-
14
-
15
-
16
-
17
-
18
-
19
-
20
-
21
-
22
-
23
-
24
-
25
-
26
-
27
-
28
-
29
-
30
-
31
-
32
-
33
-
34
-
35
-
36
-
37
-
38
-
39
-
40
-
41
-
42
-
43
-
44
-
45
-
46
-
47
-
48
-
49
-
50
-
51
-
52
-
53
-
 54
54 -
 55
55 -
 56
56 -
 57
57 -
 58
58 -
 59
59 -
 60
60 -
 61
61 -
 62
62 -
 63
63 -
 64
64 -
 65
65 -
 66
66 -
 67
67 -
 68
68 -
 69
69 -
 70
70 -
 71
71 -
 72
72 -
 73
73 -
 74
74 -
75
-
76
-
77
-
78
-
79
-
80
-
81
-
82
-
83
-
84
-
85
-
86
-
87
-
88
-
89
-
90
-
91
-
92
-
93
-
94
-
95
-
96
-
97
-
98
-
99
-
100
-
101
-
102
-
103
-
104
-
105
-
106
-
107
-
108
-
109
-
110
-
111
-
112
-
113
-
114
-
115
-
116
-
117
-
118
-
119
-
120
-
121
-
122
-
123
-
124
-
125
-
126
-
127
-
128
-
129
-
130
-
131
-
132
-
133
-
134
-
135
-
136
-
137
-
138
-
139
-
140
-
141
-
142
-
143
-
144
-
145
-
146
-
147
-
148
 |
 |

52
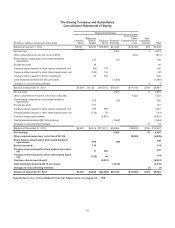
The Boeing Company and Subsidiaries
Consolidated Statements of Equity
Boeing shareholders
(Dollars in millions, except per share data)
Common
Stock
Additional
Paid-In
Capital
Treasury
Stock
Retained
Earnings
Accumulated
Other
Comprehensive
Loss
Non-
controlling
Interest Total
Balance at January 1, 2012 $5,061 $4,033 ($16,603) $27,524 ($16,500)$93 $3,608
Net earnings 3,900 3 3,903
Other comprehensive loss, net of tax of $536 (916) (916)
Share-based compensation and related dividend
equivalents 215 (27) 188
Excess tax pools 45 45
Treasury shares issued for stock options exercised, net (54)174 120
Treasury shares issued for other share-based plans, net (183)116 (67)
Treasury shares issued for 401(k) contribution 66 376 442
Cash dividends declared ($1.805 per share) (1,360) (1,360)
Changes in noncontrolling interests 44
Balance at December 31, 2012 $5,061 $4,122 ($15,937) $30,037 ($17,416)$100 $5,967
Net earnings 4,585 9 4,594
Other comprehensive income, net of tax of ($4,246) 7,522 7,522
Share-based compensation and related dividend
equivalents 216 (16) 200
Excess tax pools 101 101
Treasury shares issued for stock options exercised, net 109 988 1,097
Treasury shares issued for other share-based plans, net (133) 79 (54)
Common shares repurchased (2,801) (2,801)
Cash dividends declared ($2.185 per share) (1,642) (1,642)
Changes in noncontrolling interests 13 13
Balance at December 31, 2013 $5,061 $4,415 ($17,671) $32,964 ($9,894) $122 $14,997
Net earnings 5,446 10 5,456
Other comprehensive loss, net of tax of $2,199 (4,009) (4,009)
Share-based compensation and related dividend
equivalents 208 (20) 188
Excess tax pools 114 114
Treasury shares issued for stock options exercised,
net 17 326 343
Treasury shares issued for other share-based plans,
net (129) 48 (81)
Common shares repurchased (6,001) (6,001)
Cash dividends declared ($3.10 per share) (2,210) (2,210)
Changes in noncontrolling interests (7) (7)
Balance at December 31, 2014 $5,061 $4,625 ($23,298) $36,180 ($13,903)$125 $8,790
See Notes to the Consolidated Financial Statements on pages 53 – 108.