Boeing 2014 Annual Report Download - page 54
Download and view the complete annual report
Please find page 54 of the 2014 Boeing annual report below. You can navigate through the pages in the report by either clicking on the pages listed below, or by using the keyword search tool below to find specific information within the annual report.-
 1
1 -
2
-
3
-
4
-
5
-
6
-
7
-
8
-
9
-
10
-
11
-
12
-
13
-
14
-
15
-
16
-
17
-
18
-
19
-
20
-
21
-
22
-
23
-
24
-
25
-
26
-
27
-
28
-
29
-
30
-
31
-
32
-
33
-
34
-
35
-
36
-
37
-
38
-
39
-
40
-
41
-
42
-
43
-
 44
44 -
 45
45 -
 46
46 -
 47
47 -
 48
48 -
 49
49 -
 50
50 -
 51
51 -
 52
52 -
 53
53 -
 54
54 -
 55
55 -
 56
56 -
 57
57 -
 58
58 -
 59
59 -
 60
60 -
 61
61 -
 62
62 -
 63
63 -
 64
64 -
65
-
66
-
67
-
68
-
69
-
70
-
71
-
72
-
73
-
74
-
75
-
76
-
77
-
78
-
79
-
80
-
81
-
82
-
83
-
84
-
85
-
86
-
87
-
88
-
89
-
90
-
91
-
92
-
93
-
94
-
95
-
96
-
97
-
98
-
99
-
100
-
101
-
102
-
103
-
104
-
105
-
106
-
107
-
108
-
109
-
110
-
111
-
112
-
113
-
114
-
115
-
116
-
117
-
118
-
119
-
120
-
121
-
122
-
123
-
124
-
125
-
126
-
127
-
128
-
129
-
130
-
131
-
132
-
133
-
134
-
135
-
136
-
137
-
138
-
139
-
140
-
141
-
142
-
143
-
144
-
145
-
146
-
147
-
148
 |
 |

42
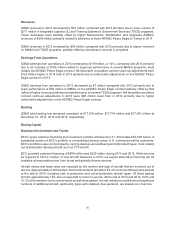
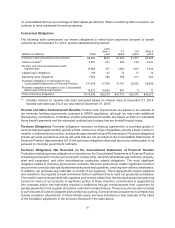
Environmental Remediation We are involved with various environmental remediation activities and have
recorded a liability of $601 million at December 31, 2014. For additional information, see Note 11 to our
Consolidated Financial Statements.
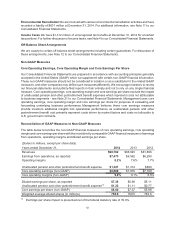
Income Taxes We have $1,312 million of unrecognized tax benefits at December 31, 2014 for uncertain
tax positions. For further discussion of income taxes, see Note 4 to our Consolidated Financial Statements.
Off-Balance Sheet Arrangements
We are a party to certain off-balance sheet arrangements including certain guarantees. For discussion of
these arrangements, see Note 12 to our Consolidated Financial Statements.
Non-GAAP Measures
Core Operating Earnings, Core Operating Margin and Core Earnings Per Share
Our Consolidated Financial Statements are prepared in accordance with accounting principles generally
accepted in the United States (GAAP) which we supplement with certain non-GAAP financial information.
These non-GAAP measures should not be considered in isolation or as a substitute for the related GAAP
measures, and other companies may define such measures differently. We encourage investors to review
our financial statements and publicly-filed reports in their entirety and not to rely on any single financial
measure. Core operating earnings, core operating margin and core earnings per share exclude the impact
of unallocated pension and other postretirement benefit expenses which represent costs not attributable
to business segments - see Note 21 to our Consolidated Financial Statements. Management uses core
operating earnings, core operating margin and core earnings per share for purposes of evaluating and
forecasting underlying business performance. Management believes these core earnings measures
provide investors additional insights into operational performance as unallocated pension and other
postretirement benefit cost primarily represent costs driven by market factors and costs not allocable to
U.S. government contracts.
Reconciliation of GAAP Measures to Non-GAAP Measures
The table below reconciles the non-GAAP financial measures of core operating earnings, core operating
margin and core earnings per share with the most directly comparable GAAP financial measures of earnings
from operations, operating margins and diluted earnings per share.
(Dollars in millions, except per share data)
Years ended December 31, 2014 2013 2012
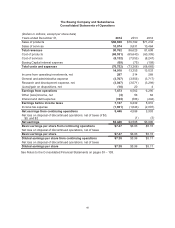
Revenues $90,762 $86,623 $81,698
Earnings from operations, as reported $7,473 $6,562 $6,290
Operating margins 8.2% 7.6% 7.7%
Unallocated pension and other postretirement benefit expense $1,387 $1,314 $899
Core operating earnings (non-GAAP) $8,860 $7,876 $7,189
Core operating margins (non-GAAP) 9.8% 9.1% 8.8%
Diluted earnings per share, as reported $7.38 $5.96 $5.11
Unallocated pension and other postretirement benefit expense(1) $1.22 $1.11 $0.77
Core earnings per share (non-GAAP) $8.60 $7.07 $5.88
Weighted average diluted shares (in millions) 738.0 769.5 763.8
(1) Earnings per share impact is presented net of the federal statutory rate of 35.0%.