Boeing 2014 Annual Report Download - page 30
Download and view the complete annual report
Please find page 30 of the 2014 Boeing annual report below. You can navigate through the pages in the report by either clicking on the pages listed below, or by using the keyword search tool below to find specific information within the annual report.-
 1
1 -
2
-
3
-
4
-
5
-
6
-
7
-
8
-
9
-
10
-
11
-
12
-
13
-
14
-
15
-
16
-
17
-
18
-
19
-
 20
20 -
 21
21 -
 22
22 -
 23
23 -
 24
24 -
 25
25 -
 26
26 -
 27
27 -
 28
28 -
 29
29 -
 30
30 -
 31
31 -
 32
32 -
 33
33 -
 34
34 -
 35
35 -
 36
36 -
 37
37 -
 38
38 -
 39
39 -
 40
40 -
41
-
42
-
43
-
44
-
45
-
46
-
47
-
48
-
49
-
50
-
51
-
52
-
53
-
54
-
55
-
56
-
57
-
58
-
59
-
60
-
61
-
62
-
63
-
64
-
65
-
66
-
67
-
68
-
69
-
70
-
71
-
72
-
73
-
74
-
75
-
76
-
77
-
78
-
79
-
80
-
81
-
82
-
83
-
84
-
85
-
86
-
87
-
88
-
89
-
90
-
91
-
92
-
93
-
94
-
95
-
96
-
97
-
98
-
99
-
100
-
101
-
102
-
103
-
104
-
105
-
106
-
107
-
108
-
109
-
110
-
111
-
112
-
113
-
114
-
115
-
116
-
117
-
118
-
119
-
120
-
121
-
122
-
123
-
124
-
125
-
126
-
127
-
128
-
129
-
130
-
131
-
132
-
133
-
134
-
135
-
136
-
137
-
138
-
139
-
140
-
141
-
142
-
143
-
144
-
145
-
146
-
147
-
148
 |
 |

18
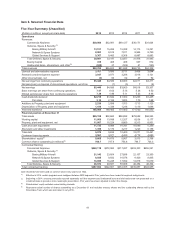
Item 6. Selected Financial Data
Five-Year Summary (Unaudited)
(Dollars in millions, except per share data) 2014 2013 2012 2011 2010
Operations
Revenues:
Commercial Airplanes $59,990 $52,981 $49,127 $36,171 $31,834
Defense, Space & Security:(1)
Boeing Military Aircraft 13,511 15,285 15,388 14,115 13,291
Network & Space Systems 8,003 8,512 7,911 8,964 9,769
Global Services & Support 9,367 9,400 9,308 8,897 8,883
Total Defense, Space & Security 30,881 33,197 32,607 31,976 31,943
Boeing Capital 416 408 468 547 672
Unallocated items, eliminations, and other(2) (525)37 (504) 41 (143)
Total revenues $90,762 $86,623 $81,698 $68,735 $64,306
General and administrative expense 3,767 3,956 3,717 3,408 3,644
Research and development expense 3,047 3,071 3,298 3,918 4,121
Other income/(loss), net (3) 56 62 47 52
Net earnings from continuing operations $5,446 $4,586 $3,903 $4,011 $3,311
Net gain/(loss) on disposal of discontinued operations, net of tax (1) (3) 7 (4)
Net earnings $5,446 $4,585 $3,900 $4,018 $3,307
Basic earnings per share from continuing operations 7.47 6.03 5.15 5.38 4.50
Diluted earnings per share from continuing operations 7.38 5.96 5.11 5.33 4.46
Cash dividends declared $2,210 $1,642 $1,360 $1,263 $1,245
Per share 3.10 2.185 1.805 1.70 1.68
Additions to Property, plant and equipment 2,236 2,098 1,703 1,713 1,125
Depreciation of Property, plant and equipment 1,414 1,338 1,248 1,119 1,096
Year-end workforce 165,500 168,400 174,400 171,700 160,500
Financial position at December 31
Total assets $99,198 $92,663 $88,896 $79,986 $68,565
Working capital 11,068 13,588 12,327 8,536 5,177
Property, plant and equipment, net 11,007 10,224 9,660 9,313 8,931
Cash and cash equivalents 11,733 9,088 10,341 10,049 5,359
Short-term and other investments 1,359 6,170 3,217 1,223 5,158
Total debt 9,070 9,635 10,409 12,371 12,421
Customer financing assets 3,561 3,971 4,420 4,772 4,680
Shareholders’ equity(3) 8,665 14,875 5,867 3,515 2,766
Common shares outstanding (in millions)(4) 706.7 747.4 755.6 744.7 735.3
Contractual Backlog:
Commercial Airplanes $440,118 $372,980 $317,287 $293,303 $255,591
Defense, Space & Security:(1)
Boeing Military Aircraft 21,143 23,604 27,898 22,107 23,350
Network & Space Systems 8,935 9,832 10,078 9,429 9,935
Global Services & Support 16,896 16,245 17,092 14,818 15,079
Total Defense, Space & Security 46,974 49,681 55,068 46,354 48,364
Total contractual backlog $487,092 $422,661 $372,355 $339,657 $303,955
Cash dividends have been paid on common stock every year since 1942.
(1) Effective in 2014, certain programs were realigned between BDS segments. Prior years have been recast for segment realignments.
(2) Beginning in 2014, amounts previously reported separately as Other segment and Unallocated items and eliminations are now presented on a
combined basis to provide a more meaningful presentation. Prior years have been adjusted to reflect the change.
(3) Shareholders’ equity excludes noncontrolling interests.
(4) Represents actual number of shares outstanding as of December 31 and excludes treasury shares and the outstanding shares held by the
ShareValue Trust, which was terminated in July 2010.