Boeing 2014 Annual Report Download - page 117
Download and view the complete annual report
Please find page 117 of the 2014 Boeing annual report below. You can navigate through the pages in the report by either clicking on the pages listed below, or by using the keyword search tool below to find specific information within the annual report.-
 1
1 -
2
-
3
-
4
-
5
-
6
-
7
-
8
-
9
-
10
-
11
-
12
-
13
-
14
-
15
-
16
-
17
-
18
-
19
-
20
-
21
-
22
-
23
-
24
-
25
-
26
-
27
-
28
-
29
-
30
-
31
-
32
-
33
-
34
-
35
-
36
-
37
-
38
-
39
-
40
-
41
-
42
-
43
-
44
-
45
-
46
-
47
-
48
-
49
-
50
-
51
-
52
-
53
-
54
-
55
-
56
-
57
-
58
-
59
-
60
-
61
-
62
-
63
-
64
-
65
-
66
-
67
-
68
-
69
-
70
-
71
-
72
-
73
-
74
-
75
-
76
-
77
-
78
-
79
-
80
-
81
-
82
-
83
-
84
-
85
-
86
-
87
-
88
-
89
-
90
-
91
-
92
-
93
-
94
-
95
-
96
-
97
-
98
-
99
-
100
-
101
-
102
-
103
-
104
-
105
-
106
-
 107
107 -
 108
108 -
 109
109 -
 110
110 -
 111
111 -
 112
112 -
 113
113 -
 114
114 -
 115
115 -
 116
116 -
 117
117 -
 118
118 -
 119
119 -
 120
120 -
 121
121 -
 122
122 -
 123
123 -
 124
124 -
 125
125 -
 126
126 -
 127
127 -
128
-
129
-
130
-
131
-
132
-
133
-
134
-
135
-
136
-
137
-
138
-
139
-
140
-
141
-
142
-
143
-
144
-
145
-
146
-
147
-
148
 |
 |

105
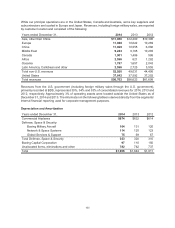
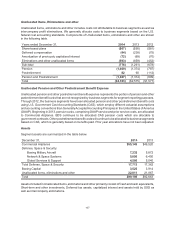
While our principal operations are in the United States, Canada and Australia, some key suppliers and
subcontractors are located in Europe and Japan. Revenues, including foreign military sales, are reported
by customer location and consisted of the following:
Years ended December 31, 2014 2013 2012
Asia, other than China $11,900 $12,200 $10,390
Europe 11,898 10,622 10,269
China 11,029 10,555 6,086
Middle East 9,243 9,165 10,285
Canada 1,901 1,486 586
Africa 2,596 621 1,282
Oceania 1,757 1,657 2,043
Latin America, Caribbean and other 2,596 2,725 3,555
Total non-U.S. revenues 52,920 49,031 44,496
United States 37,842 37,592 37,202
Total revenues $90,762 $86,623 $81,698
Revenues from the U.S. government (including foreign military sales through the U.S. government),
primarily recorded at BDS, represented 30%, 34% and 33% of consolidated revenues for 2014, 2013 and
2012, respectively. Approximately 3% of operating assets were located outside the United States as of
December 31, 2014 and 2013. The information in the following tables is derived directly from the segments’
internal financial reporting used for corporate management purposes.
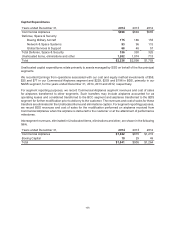
Depreciation and Amortization
Years ended December 31, 2014 2013 2012
Commercial Airplanes $674 $632 $614
Defense, Space & Security:
Boeing Military Aircraft 164 131 120
Network & Space Systems 114 120 123
Global Services & Support 75 69 67
Total Defense, Space & Security 353 320 310
Boeing Capital Corporation 97 110 150
Unallocated items, eliminations and other 782 782 737
Total $1,906 $1,844 $1,811