Avon 2008 Annual Report Download - page 77
Download and view the complete annual report
Please find page 77 of the 2008 Avon annual report below. You can navigate through the pages in the report by either clicking on the pages listed below, or by using the keyword search tool below to find specific information within the annual report.-
 1
1 -
2
-
3
-
4
-
5
-
6
-
7
-
8
-
9
-
10
-
11
-
12
-
13
-
14
-
15
-
16
-
17
-
18
-
19
-
20
-
21
-
22
-
23
-
24
-
25
-
26
-
27
-
28
-
29
-
30
-
31
-
32
-
33
-
34
-
35
-
36
-
37
-
38
-
39
-
40
-
41
-
42
-
43
-
44
-
45
-
46
-
47
-
48
-
49
-
50
-
51
-
52
-
53
-
54
-
55
-
56
-
57
-
58
-
59
-
60
-
61
-
62
-
63
-
64
-
65
-
66
-
 67
67 -
 68
68 -
 69
69 -
 70
70 -
 71
71 -
 72
72 -
 73
73 -
 74
74 -
 75
75 -
 76
76 -
 77
77 -
 78
78 -
 79
79 -
 80
80 -
 81
81 -
 82
82 -
 83
83 -
 84
84 -
 85
85 -
 86
86 -
 87
87 -
88
-
89
-
90
-
91
-
92
 |
 |

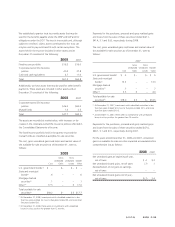
We established a grantor trust to provide assets that may be
used for the benefits payable under the SERP and SLIP and for
obligations under the DCP. The trust is irrevocable and, although
subject to creditors’ claims, assets contributed to the trust can
only be used to pay such benefits with certain exceptions. The
assets held in the trust are included in other assets and at
December 31 consisted of the following:
2008 2007
Fixed-income portfolio $16.3 $16.0
Corporate-owned life insurance
policies 40.2 37.8
Cash and cash equivalents 4.7 11.0
Total $61.2 $64.8
Additionally, we have assets that may be used for other benefit
payments. These assets are included in other assets and at
December 31 consisted of the following:
2008 2007
Corporate-owned life insurance
policies $46.3 $60.0
Mutual funds 1.4 2.5
Total $47.7 $62.5
The assets are recorded at market value, with increases or de-
creases in the corporate-owned life insurance policies reflected in
the Consolidated Statements of Income.
The fixed-income portfolio held in the grantor trust and the
mutual funds are classified as available-for-sale securities.
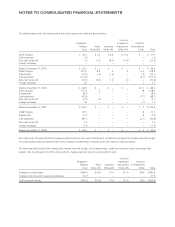
The cost, gross unrealized gains and losses and market value of
the available-for-sale securities as of December 31, were as
follows:
2008
Cost
Gross
Unrealized
Gains
Gross
Unrealized
Losses
Market
Value
U.S. government bonds (1) $– $– $–$–
State and municipal
bonds(1) .6 – – .6
Mortgage backed
securities(1) .1 – – .1
Other(1) 17.5 – .5 17.0
Total available-for-sale
securities(2) $18.2 $– $.5 $17.7
(1) At December 31, 2008, investments with scheduled maturities in less
than two years totaled $.2, two to five years totaled $0, and more than
five years totaled $.6.
(2) At December 31, 2008, there were no investments with unrealized
losses in a loss position for greater than 12 months.
Payments for the purchases, proceeds and gross realized gains
and losses from the sales of these securities totaled $42.1,
$41.4, $.1 and $(.6), respectively, during 2008.
The cost, gross unrealized gains and losses and market value of
the available-for-sale securities as of December 31, were as
follows:
2007
Cost
Gross
Unrealized
Gains
Gross
Unrealized
Losses
Market
Value
U.S. government bonds(1) $.5 $– $–$.5
State and municipal
bonds(1) 13.3 – – 13.3
Mortgage backed
securities(1) .7 – – .7
Other(1) 3.5 .5 – 4.0
Total available-for-sale
securities(2) $18.0 $.5 $– $18.5
(1) At December 31, 2007, investments with scheduled maturities in less
than two years totaled $2.0, two to five years totaled $2.5, and more
than five years totaled $10.5.
(2) At December 31, 2007, there were no investments with unrealized
losses in a loss position for greater than 12 months.
Payments for the purchases, proceeds and gross realized gains
and losses from the sales of these securities totaled $47.0,
$46.1, $.1 and $(.1), respectively, during 2007.
For the years ended December 31, 2008 and 2007, unrealized
gains on available-for-sale securities impacted accumulated other
comprehensive loss as follows:
2008 2007
Net unrealized gains at beginning of year,
net of taxes $ .4 $.3
Net unrealized (losses) gains, net of taxes (.7) .1
Reclassification of net gains to earnings,
net of taxes – –
Net unrealized (losses) gains end of year,
net of taxes $(.3) $.4
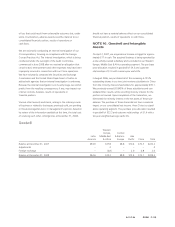
A V O N 2008 F-25