Avon 2008 Annual Report Download - page 27
Download and view the complete annual report
Please find page 27 of the 2008 Avon annual report below. You can navigate through the pages in the report by either clicking on the pages listed below, or by using the keyword search tool below to find specific information within the annual report.-
 1
1 -
2
-
3
-
4
-
5
-
6
-
7
-
8
-
9
-
10
-
11
-
12
-
13
-
14
-
15
-
16
-
 17
17 -
 18
18 -
 19
19 -
 20
20 -
 21
21 -
 22
22 -
 23
23 -
 24
24 -
 25
25 -
 26
26 -
 27
27 -
 28
28 -
 29
29 -
 30
30 -
 31
31 -
 32
32 -
 33
33 -
 34
34 -
 35
35 -
 36
36 -
 37
37 -
38
-
39
-
40
-
41
-
42
-
43
-
44
-
45
-
46
-
47
-
48
-
49
-
50
-
51
-
52
-
53
-
54
-
55
-
56
-
57
-
58
-
59
-
60
-
61
-
62
-
63
-
64
-
65
-
66
-
67
-
68
-
69
-
70
-
71
-
72
-
73
-
74
-
75
-
76
-
77
-
78
-
79
-
80
-
81
-
82
-
83
-
84
-
85
-
86
-
87
-
88
-
89
-
90
-
91
-
92
 |
 |
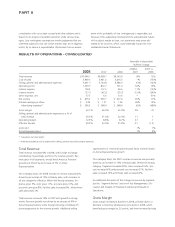
We believe that our strong operating cash flow and global cash
balances of over $1 billion, coupled with the continuing execu-
tion of our turnaround strategies and the competitive advan-
tages of our direct selling business model, will allow us to look
beyond our anticipated challenges in 2009 and continue our
focus on long-term sustainable, profitable growth.
STRATEGIC INITIATIVES
Advertising and Representative Value
Proposition (“RVP”)
Investing in advertising is a key strategy. We significantly
increased spending on advertising over the past three years.
During 2008, we increased our investment in advertising by
$22.1 or 6%. Approximately 70% of the incremental spending
was spent in Russia, China and the United Kingdom. The incre-
mental spending on advertising was at a rate somewhat less
than revenue growth. The advertising investments supported
new product launches, such as, Anew Ultimate Contouring Eye
System, Bond Girl fragrance, Pro-to-Go Lipstick,Anew Ultimate
Age Repair Elixir, Supershock Mascara, Avon Solutions Hydra-
Radiance, U by Ungaro fragrancesand Anew Rejuvenate Eye.
Advertising investments also included advertising to recruit
Representatives. We have also continued to forge alliances
with celebrities, including alliances with Patrick Dempsey and
Ferragamo Parfums S.P.A. for the “U by Ungaro” line of
fragrances.
We continued to invest in our direct-selling channel to improve
the reward and effort equation for our Representatives. We have
committed significant investments for extensive research to de-
termine the payback on advertising and field tools and actions,
and the optimal balance of these tools and actions in our mar-
kets. We have allocated these significant investments in propri-
etary direct selling analytics to better understand the drivers of
value for our Representatives. We measure our investment in
RVP as the incremental cost to provide these value-enhancing
initiatives. During 2008, we invested approximately $83 incre-
mentally in our Representatives through RVP by continued
implementation of our Sales Leadership program, enhanced
incentives, increased sales campaign frequency, improved com-
missions and new e-business tools. This incremental investment
was ahead of revenue growth. Investing in RVP will continue to
be a key strategy. We will continue to look for ways to improve
the earnings opportunity for Representatives through various
means, including the following:
• Evaluating optimum discount structures in select markets;
• Continuing the roll-out of our Sales Leadership Program,
which offers Representatives an enhanced career opportunity;
• Strategically examining the fee structure and brochure costs to
enhance Representative economics;
• Recalibrating the frequency of campaigns to maximize
Representative selling opportunities; and
• Applying the optimal balance of advertising and field
investment in our key markets.
While the reward and effort will be different within our global
portfolio of businesses, we believe that web enablement is a key
element to reduce Representative effort worldwide. We will
continue to focus on improving Internet-based tools for our
Representatives.
Product Line Simplification
During 2006, we began to analyze our product line, under our
PLS program, to develop a smaller range of better performing,
more profitable products. The overall goal of PLS is to identify an
improved product assortment to drive higher sales of more
profitable products. During 2007, we completed the analysis of
our product portfolio, concluded on the appropriate product
assortment going forward and made decisions regarding the
ultimate disposition of products that will no longer be part of our
improved product assortment (such as selling at a discount, dona-
tion, or destruction). During 2007 and 2006, we recorded PLS
charges of $187.8 and $81.4, respectively, primarily incremental
inventory obsolescence expense of $167.3 and $72.6, respec-
tively. We recorded final PLS charges in the fourth quarter of
2007. During the first half of 2008, we began to implement PLS
in the U.K and early results appear favorable; however, the tran-
sition is a long process and will continue into 2009. In the second
half of 2008, we began implementing PLS in all other markets,
with full implementation expected by the end of 2009.
We expect that sales and marketing benefits will account for
approximately 85% of our projected benefits. Improving our
product assortment will allow us to increase exposure and
improve presentation of the remaining products within our
brochure, which is expected to yield more pleasurable consumer
shopping experiences, easier Representative selling experiences,
and greater sales per brochure page. A second source of benefits
from PLS results from “transferable demand.” Transferable
demand refers to the concept that when products with redun-
dant characteristics are removed from our product assortment,
some demand from the eliminated products will transfer to the
remaining products that offer similar or comparable product
characteristics. As part of PLS, when we identify products that
have sufficient overlap of characteristics, we will eliminate the
products with the lowest profitability and we expect the prod-
ucts that we retain will generate more profit. A third source of
benefits from PLS is less price discounting. As we implement
operating procedures under PLS, we anticipate introducing fewer
new products and lengthening the lifecycle of products in our
offering, which we expect will lead to less aggressive price dis-
counting over a product’s life cycle.
A V O N 2008 21