Avon 2008 Annual Report Download - page 33
Download and view the complete annual report
Please find page 33 of the 2008 Avon annual report below. You can navigate through the pages in the report by either clicking on the pages listed below, or by using the keyword search tool below to find specific information within the annual report.-
 1
1 -
2
-
3
-
4
-
5
-
6
-
7
-
8
-
9
-
10
-
11
-
12
-
13
-
14
-
15
-
16
-
17
-
18
-
19
-
20
-
21
-
22
-
 23
23 -
 24
24 -
 25
25 -
 26
26 -
 27
27 -
 28
28 -
 29
29 -
 30
30 -
 31
31 -
 32
32 -
 33
33 -
 34
34 -
 35
35 -
 36
36 -
 37
37 -
 38
38 -
 39
39 -
 40
40 -
 41
41 -
 42
42 -
 43
43 -
44
-
45
-
46
-
47
-
48
-
49
-
50
-
51
-
52
-
53
-
54
-
55
-
56
-
57
-
58
-
59
-
60
-
61
-
62
-
63
-
64
-
65
-
66
-
67
-
68
-
69
-
70
-
71
-
72
-
73
-
74
-
75
-
76
-
77
-
78
-
79
-
80
-
81
-
82
-
83
-
84
-
85
-
86
-
87
-
88
-
89
-
90
-
91
-
92
 |
 |
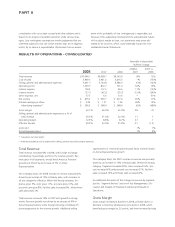
and favorable product mix, which benefited gross margin by 1.3
points. These benefits to gross margin were partially offset by
higher commodity costs and the unfavorable impact of foreign
exchange on product cost in Europe. 2007 included incremental
inventory obsolescence charges of $167.3 related to our PLS
program. Obsolescence expense for 2008 also benefited by
approximately $13 from changes in estimates to our disposition
plan under our PLS program.
Gross margin decreased .7 point in 2007, primarily due to an
increase in inventory obsolescence provisions of approximately
$100 in 2007, which negatively impacted gross margin by 1.1
points, and an unfavorable mix of products sold, partially offset
by supply chain efficiencies. As discussed in the Overview sec-
tion, 2007 and 2006 included incremental inventory obso-
lescence charges of $167.3 and $72.6, respectively, related to
our decision to discontinue the sale of certain products as part of
our PLS program. Additionally, 2006 included incremental
inventory obsolescence charges of $20.5 related to our decisions
to discontinue the sale of certain heavily discounted products.
Selling, General and Administrative
Expenses
Selling, general and administrative expenses increased $276.9
during 2008, primarily due to the following:
• higher investments in RVP and advertising of approximately
$105;
• higher variable expenses such as freight from increased sales
volume and brochure costs;
• higher overhead primarily due to higher marketing costs; and
• the impact of foreign exchange.
These higher costs were partially offset by lower costs incurred
to implement our restructuring initiatives of $99.8, due to costs
associated with previously approved initiatives.
Selling, general and administrative expenses increased $538.8
during 2007, primarily due to the following:
• higher investments in advertising and RVP of approximately
$240;
• higher variable expenses such as freight and commissions from
increased sales volume; and
• increased distribution costs as a percentage of revenue.
These higher costs were partially offset by $71.8 of lower costs
incurred to implement our restructuring initiatives and savings
associated with position eliminations resulting from restructur-
ing initiatives. Additionally, 2007 benefited from a favorable
comparison to 2006 which included a one-time charge of $21.0
related to the resolution of a long-standing dispute regarding
value-added taxes in the U.K., the recognition of unclaimed
sales-related tax credits and a reduction of a reserve for statutory
liabilities.
See the “Segment Review” section of Management’s Discussion
and Analysis of Financial Condition and Results of Operations for
additional information related to changes in operating margin by
segment.
Other Expenses
Interest expense decreased in 2008, primarily due to lower
domestic interest rates. Interest expense increased in 2007 as
compared to 2006, mainly due to higher borrowings to support
our share repurchase programs, as well as increases in domestic
interest rates. At December 31, 2008 and 2007, we held interest
rate swap agreements that effectively converted approximately
50% and 30% of our outstanding long-term, fixed-rate borrow-
ings to a variable interest rate based on LIBOR, respectively. The
total exposure of our debt to floating interest rates at Decem-
ber 31, 2008, and December 31, 2007, was approximately 65%
and 60%, respectively.
Interest income decreased in 2008, primarily due to lower
interest rates. Interest income decreased in 2007 as compared to
2006, primarily due to lower cash and cash equivalent balances.
Other expense, net increased in 2008, primarily due to net
foreign exchange losses in 2008, as compared to foreign
exchange gains in 2007. Other expense, net decreased in 2007
as compared to 2006, primarily due to higher net foreign
exchange gains in 2007.
Effective Tax Rate
The effective tax rate for 2008 was 29.3%, compared to 33.0%
for 2007 and 31.8% for 2006.
During 2008, the tax rate was favorably impacted by 3.8 points
due to an audit settlement, partially offset by 1.2 points from the
establishment of a valuation allowance against deferred tax
assets. The rate was also favorably impacted by changes in the
earnings mix of international subsidiaries, which is not expected
to recur. During 2007, the tax rate was favorably impacted by
approximately 2.0 points due to the net release of valuation
allowances, partially offset by the unfavorable impact of restruc-
turing and PLS initiatives. During 2006, the effective tax rate was
favorably impacted by approximately 4.0 points due to the clo-
sure of tax years by expiration of the statute of limitations and
audit settlements as well as 1.7 points due to tax refunds. These
benefits were partially offset by the repatriation of international
earnings, which increased the rate by approximately 3.1 points,
and the tax impact associated with our restructuring charges due
to the lower weighted-average effective tax rate of subsidiaries
incurring the charges.
A V O N 2008 27