Avon 2008 Annual Report Download - page 34
Download and view the complete annual report
Please find page 34 of the 2008 Avon annual report below. You can navigate through the pages in the report by either clicking on the pages listed below, or by using the keyword search tool below to find specific information within the annual report.-
 1
1 -
2
-
3
-
4
-
5
-
6
-
7
-
8
-
9
-
10
-
11
-
12
-
13
-
14
-
15
-
16
-
17
-
18
-
19
-
20
-
21
-
22
-
23
-
 24
24 -
 25
25 -
 26
26 -
 27
27 -
 28
28 -
 29
29 -
 30
30 -
 31
31 -
 32
32 -
 33
33 -
 34
34 -
 35
35 -
 36
36 -
 37
37 -
 38
38 -
 39
39 -
 40
40 -
 41
41 -
 42
42 -
 43
43 -
 44
44 -
45
-
46
-
47
-
48
-
49
-
50
-
51
-
52
-
53
-
54
-
55
-
56
-
57
-
58
-
59
-
60
-
61
-
62
-
63
-
64
-
65
-
66
-
67
-
68
-
69
-
70
-
71
-
72
-
73
-
74
-
75
-
76
-
77
-
78
-
79
-
80
-
81
-
82
-
83
-
84
-
85
-
86
-
87
-
88
-
89
-
90
-
91
-
92
 |
 |

PART II
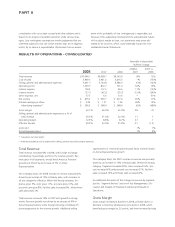
SEGMENT REVIEW
Below is an analysis of the key factors affecting revenue and operating profit by reportable segment for each of the years in the three-year
period ended December 31, 2008.
Years ended December 31 2008 2007 2006
Total
Revenue
Operating
Profit
Total
Revenue
Operating
Profit
Total
Revenue
Operating
Profit
Latin America $ 3,884.1 $ 690.3 $3,298.9 $ 483.1 $2,743.4 $ 424.0
North America 2,492.7 213.9 2,622.1 213.1 2,554.0 181.6
Central & Eastern Europe 1,719.5 346.2 1,577.8 296.1 1,320.2 296.7
Western Europe, Middle East &
Africa 1,351.7 121.0 1,308.6 33.9 1,123.7 (17.8)
Asia Pacific 891.2 102.4 850.8 64.3 810.8 42.5
China 350.9 17.7 280.5 2.0 211.8 (10.8)
Total from operations 10,690.1 1,491.5 9,938.7 1,092.5 8,763.9 916.2
Global and other expenses – (152.2) – (219.8) – (154.8)
Total 10,690.1 1,339.3 $9,938.7 $ 872.7 $8,763.9 $ 761.4
Global and other expenses include, among other things, costs
related to our executive and administrative offices, information
technology, research and development, and marketing. Certain
planned global expenses are allocated to our business segments
primarily based on planned revenue. The unallocated costs remain
as global and other expenses. We do not allocate costs of
implementing restructuring initiatives related to our global func-
tions to our segments. Costs of implementing restructuring ini-
tiatives related to a specific segment are recorded within that
segment.
2008 2007 % Change 2007 2006 % Change
Total global expenses $ 534.5 $ 552.6 3% $ 552.6 $ 463.6 (19)%
Allocated to segments (382.3) (332.8) 15% (332.8) (308.8) 8%
Net global expenses $ 152.2 $ 219.8 31% $ 219.8 $ 154.8 (42)%
The increase in the amount allocated to the segments in 2008
was primarily due to higher global marketing and research and
development costs, higher information technology costs and
higher costs related to global initiatives. The decrease in net
global expenses was primarily due to lower costs to implement
restructuring initiatives and lower professional service fees asso-
ciated with our PLS initiative.
The increase in the amount allocated to the segments in 2007
was primarily due to higher global marketing costs, reflecting
increased spending for market research, research and develop-
ment, and advertising. The increase in net global expenses in
2007 was primarily due to higher costs related to global ini-
tiatives, higher information technology costs and higher
performance-based compensation expense.
Latin America – 2008 Compared to 2007
%/Point Change
2008 2007 US$
Local
Currency
Total revenue $3,884.1 $3,298.9 18% 14%
Operating profit 690.3 483.1 43% 38%
Operating margin 17.8% 14.6% 3.2 3.0
Units sold 4%
Active Representatives 6%
Total revenue increased for 2008, driven by a larger average
order and growth in Active Representatives, as well as favorable
foreign exchange. Growth in Active Representatives reflects sig-
nificant investments in RVP and a continued high level of
investment in advertising. Revenue for 2008 benefited from
continued growth in substantially all markets. In particular, dur-
ing 2008, revenue grew 24% in Brazil, 36% in Venezuela, 5%