Avon 2008 Annual Report Download - page 25
Download and view the complete annual report
Please find page 25 of the 2008 Avon annual report below. You can navigate through the pages in the report by either clicking on the pages listed below, or by using the keyword search tool below to find specific information within the annual report.-
 1
1 -
2
-
3
-
4
-
5
-
6
-
7
-
8
-
9
-
10
-
11
-
12
-
13
-
14
-
 15
15 -
 16
16 -
 17
17 -
 18
18 -
 19
19 -
 20
20 -
 21
21 -
 22
22 -
 23
23 -
 24
24 -
 25
25 -
 26
26 -
 27
27 -
 28
28 -
 29
29 -
 30
30 -
 31
31 -
 32
32 -
 33
33 -
 34
34 -
 35
35 -
36
-
37
-
38
-
39
-
40
-
41
-
42
-
43
-
44
-
45
-
46
-
47
-
48
-
49
-
50
-
51
-
52
-
53
-
54
-
55
-
56
-
57
-
58
-
59
-
60
-
61
-
62
-
63
-
64
-
65
-
66
-
67
-
68
-
69
-
70
-
71
-
72
-
73
-
74
-
75
-
76
-
77
-
78
-
79
-
80
-
81
-
82
-
83
-
84
-
85
-
86
-
87
-
88
-
89
-
90
-
91
-
92
 |
 |

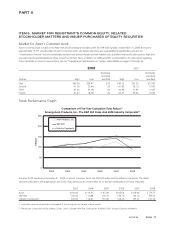
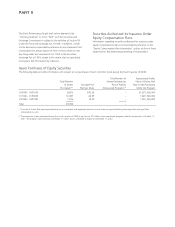
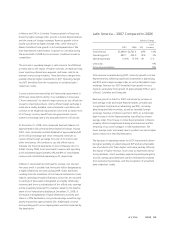
ITEM 6. SELECTED FINANCIAL DATA
We derived the following selected financial data from our audited consolidated financial statements. The following data should be read in
conjunction with “Management’s Discussion and Analysis of Financial Condition and Results of Operations” and our Consolidated Financial
Statements and related Notes.
2008 2007 (2) 2006 (3) 2005 2004
Income Data
Total revenue $10,690.1 $9,938.7 $8,763.9 $8,149.6 $7,747.8
Operating profit (1) 1,339.3 872.7 761.4 1,149.0 1,229.0
Net income 875.3 530.7 477.6 847.6 846.1
Diluted earnings per share $ 2.04 $ 1.21 $ 1.06 $ 1.81 $ 1.77
Cash dividends per share $ 0.80 $ 0.74 $ 0.70 $ 0.66 $ 0.56
Balance Sheet Data
Total assets $ 6,074.0 $5,716.2 $5,238.2 $4,761.4 $4,148.1
Debt maturing within one year 1,031.4 929.5 615.6 882.5 51.7
Long-term debt 1,456.2 1,167.9 1,170.7 766.5 866.3
Total debt 2,487.6 2,097.4 1,786.3 1,649.0 918.0
Shareholders’ equity 674.9 711.6 790.4 794.2 950.2
(1) In 2008, 2007, 2006 and 2005, operating profit includes costs to implement restructuring initiatives related to our multi-year restructuring program
announced during 2005 of $60.6, $158.3, $228.8, and $56.5, respectively.
In 2007 and 2006, operating profit includes charges totaling $187.8 and $81.4, including inventory obsolescence expense of $167.3 and $72.6, respectively,
related to our product line simplification program (“PLS”). In 2008, operating profit includes benefits to obsolescence expense of approximately $13 from
changes in our disposition plan under our PLS program.
Effective January 1, 2006, we adopted SFAS No. 123 (revised 2004) Share-Based Payment. Operating profit includes charges related to share-based compensa-
tion of $54.8, $61.6, $62.9, $10.1 and $8.8 for the years ended December 31, 2008, 2007, 2006, 2005 and 2004, respectively.
(2) In 2007, we recorded a decrease of $18.3 to shareholders’ equity from the initial adoption of Financial Accounting Standards Board (“FASB”) Interpretation
No. 48, Accounting for Uncertainty in Income Taxes – an interpretation of FASB Statement No. 109.
(3) In 2006, we recorded a decreases of $232.8 and $254.7 to total assets and shareholders’ equity, respectively, from the initial adoption of Statement of
Financial Accounting Standards (“SFAS”) No. 158, Employers’ Accounting for Defined Benefit Pension and Other Postretirement Plans—an amendment of
FASB Statements No. 87, 88, 106 and 132R.
A V O N 2008 19