Avon 2008 Annual Report Download - page 26
Download and view the complete annual report
Please find page 26 of the 2008 Avon annual report below. You can navigate through the pages in the report by either clicking on the pages listed below, or by using the keyword search tool below to find specific information within the annual report.-
 1
1 -
2
-
3
-
4
-
5
-
6
-
7
-
8
-
9
-
10
-
11
-
12
-
13
-
14
-
15
-
 16
16 -
 17
17 -
 18
18 -
 19
19 -
 20
20 -
 21
21 -
 22
22 -
 23
23 -
 24
24 -
 25
25 -
 26
26 -
 27
27 -
 28
28 -
 29
29 -
 30
30 -
 31
31 -
 32
32 -
 33
33 -
 34
34 -
 35
35 -
 36
36 -
37
-
38
-
39
-
40
-
41
-
42
-
43
-
44
-
45
-
46
-
47
-
48
-
49
-
50
-
51
-
52
-
53
-
54
-
55
-
56
-
57
-
58
-
59
-
60
-
61
-
62
-
63
-
64
-
65
-
66
-
67
-
68
-
69
-
70
-
71
-
72
-
73
-
74
-
75
-
76
-
77
-
78
-
79
-
80
-
81
-
82
-
83
-
84
-
85
-
86
-
87
-
88
-
89
-
90
-
91
-
92
 |
 |
PART II
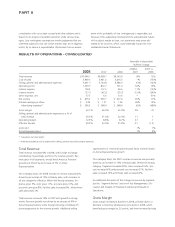
ITEM 7. MANAGEMENT’S DISCUSSION
AND ANALYSIS OF FINANCIAL
CONDITION AND RESULTS OF
OPERATIONS
The following discussion of the results of operations and finan-
cial condition of Avon Products, Inc. and its majority and wholly
owned subsidiaries (“Avon” or the “Company”) should be read
in conjunction with the information contained in the Consoli-
dated Financial Statements and related Notes. When used in
this discussion, the terms “Avon,” “Company,” “we,” “our”
or “us” mean, unless the context otherwise indicates, Avon
Products, Inc. and its majority and wholly owned subsidiaries.
OVERVIEW
We are a global manufacturer and marketer of beauty and
related products. Our business is conducted worldwide, primarily
in the direct selling channel. We presently have sales operations
in 66 countries and territories, including the United States, and
distribute products in 44 more. Our reportable segments are
based on geographic operations in six regions: Latin America;
North America; Central & Eastern Europe; Western Europe,
Middle East & Africa; Asia Pacific; and China. We centrally man-
age global Brand Marketing, Supply Chain and Sales organiza-
tions. Beginning in the fourth quarter of 2008, we changed our
product categories from Beauty, Beauty Plus and Beyond Beauty
to Beauty, Fashion and Home. Beauty consists of cosmetics,
fragrances, skin care and toiletries (“CFT”). Fashion consists of
fashion jewelry, watches, apparel, footwear and accessories.
Home consists of gift and decorative products, housewares,
entertainment and leisure, children’s and nutritional products.
Sales from Health and Wellness products and mark., a global
cosmetics brand that focuses on the market for young women,
are included among these three categories based on product
type. Sales are made to the ultimate consumer principally
through the direct selling by 5.8 million active independent Rep-
resentatives, who are independent contractors and not employ-
ees of Avon. The success of our business is highly dependent on
recruiting, retaining and servicing our Representatives.
We view the geographic diversity of our businesses as a strategic
advantage in part because it allows us to participate in higher
growth Beauty markets internationally. In developed markets,
such as the United States, we seek to achieve growth in line with
that of the overall beauty market, while in developing and
emerging markets we seek to achieve higher growth targets.
During 2008, approximately 80% of our consolidated revenue
was derived from operations outside the U.S. When we first
penetrate a market, we typically experience high growth rates
and, as we reach scale in these markets, growth rates gen-
erally decline.
At the end of 2005, we launched a comprehensive, multi-year
turnaround plan to restore sustainable growth. In January 2008,
we announced the final initiatives of our restructuring program
that was launched in 2005 under our turnaround plan. In 2007,
we completed the analysis of our optimal product portfolio and
made decisions on exit strategies for non-optimal products under
our Product Line Simplification program (“PLS”). In 2007, we also
launched our Strategic Sourcing Initiative (“SSI”). We expect our
restructuring initiatives to deliver annualized savings of approx-
imately $430 once all initiatives are fully implemented by 2011-
2012. We also expect to achieve annualized benefits in excess of
$200 and $250 from PLS and SSI, respectively, in 2010. As dis-
cussed further below, in February 2009 we announced a new
restructuring program under our multi-year turnaround plan.
During 2008, revenue increased 8%, and Active Representatives
increased 7% (with increases in all segments), fueled by invest-
ments in advertising and the Representative Value Proposition
(“RVP”). Sales from each of our product categories increased,
with products in the Beauty category increasing 10%. During
2008, revenue grew in all segments except North America,
which was adversely affected by the slowing macro-economic
environment, deteriorating consumer confidence and higher
year-over-year fuel prices. We benefited from strength in devel-
oping and emerging markets around the globe that more than
offset the unfavorable impact of economic softness in North
America. See the “Segment Review” section of Management’s
Discussion and Analysis of Financial Condition and Results of
Operations for additional information related to changes in
revenue by segment.
During the fourth quarter of 2008, revenue declined as com-
pared to 2007, due to the significant negative impact of foreign
exchange and the depressed economy. We expect the global
economic pressures and negative impact of foreign currency will
continue or could worsen in the foreseeable future and 2009
will be a challenging year. Given the current macro-economic
environment, we expect that revenue growth in 2009 will be
somewhat lower than our long-term revenue growth, which is
expected to average mid-single digits, excluding the impact of
foreign exchange. We also expect that operating margin in 2009
will continue to be pressured by the unfavorable impacts of for-
eign exchange. Operating margin will also be negatively impact-
ed by additional restructuring charges during 2009. We believe
benefits from our SSI program, focusing on manufacturing
productivity, changing sourcing of raw materials and finished
goods to use exchange rates to our advantage, and some soften-
ing in commodity costs will help to partially offset the negative
impact of foreign exchange. We will continue to look for ways to
transform our cost structure and intend to reduce non-strategic
spending during 2009. We will also continue our strategies of
investing in advertising and our Representatives.