Avon 2008 Annual Report Download - page 32
Download and view the complete annual report
Please find page 32 of the 2008 Avon annual report below. You can navigate through the pages in the report by either clicking on the pages listed below, or by using the keyword search tool below to find specific information within the annual report.-
 1
1 -
2
-
3
-
4
-
5
-
6
-
7
-
8
-
9
-
10
-
11
-
12
-
13
-
14
-
15
-
16
-
17
-
18
-
19
-
20
-
21
-
 22
22 -
 23
23 -
 24
24 -
 25
25 -
 26
26 -
 27
27 -
 28
28 -
 29
29 -
 30
30 -
 31
31 -
 32
32 -
 33
33 -
 34
34 -
 35
35 -
 36
36 -
 37
37 -
 38
38 -
 39
39 -
 40
40 -
 41
41 -
 42
42 -
43
-
44
-
45
-
46
-
47
-
48
-
49
-
50
-
51
-
52
-
53
-
54
-
55
-
56
-
57
-
58
-
59
-
60
-
61
-
62
-
63
-
64
-
65
-
66
-
67
-
68
-
69
-
70
-
71
-
72
-
73
-
74
-
75
-
76
-
77
-
78
-
79
-
80
-
81
-
82
-
83
-
84
-
85
-
86
-
87
-
88
-
89
-
90
-
91
-
92
 |
 |

PART II
consultation with our outside counsel and other advisors and is
based on an analysis of possible outcomes under various strat-
egies. Loss contingency assumptions involve judgments that are
inherently subjective and can involve matters that are in litigation,
which, by its nature is unpredictable. We believe that our assess-
ment of the probability of loss contingencies is reasonable, but
because of the subjectivity involved and the unpredictable nature
of the subject matter at issue, our assessment may prove ulti-
mately to be incorrect, which could materially impact the Con-
solidated Financial Statements.
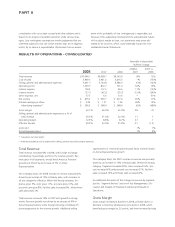
RESULTS OF OPERATIONS – CONSOLIDATED
Favorable (Unfavorable)
%/Point Change
2008 2007 2006
2008 vs.
2007
2007 vs.
2006
Total revenue $10,690.1 $9,938.7 $8,763.9 8% 13%
Cost of sales 3,949.1 3,941.2 3,416.5 –% (15)%
Selling, general and administrative expenses 5,401.7 5,124.8 4,586.0 (5)% (12)%
Operating profit 1,339.3 872.7 761.4 53% 15%
Interest expense 100.4 112.2 99.6 11% (13)%
Interest income (37.1) (42.2) (55.3) (12)% (24)%
Other expense, net 37.7 6.6 13.6 * 51%
Net income $ 875.3 $ 530.7 $ 477.6 65% 11%
Diluted earnings per share $ 2.04 $ 1.21 $ 1.06 69% 14%
Advertising expenses(1) $ 390.5 $ 368.4 $ 248.9 (6)% (48)%
Gross margin 63.1% 60.3% 61.0% 2.8 (.7)
Selling, general and administrative expenses as a % of
total revenue 50.5% 51.6% 52.3% 1.1 .7
Operating margin 12.5% 8.8% 8.7% 3.7 .1
Effective tax rate 29.3% 33.0% 31.8% 3.7 (1.2)
Units sold 1% 7%
Active Representatives 7% 9%
* Calculation not meaningful
(1) Advertising expenses are included within selling, general and administrative expenses.
Total Revenue
Total revenue increased 8% in 2008, with foreign exchange
contributing 3 percentage points to the revenue growth. Rev-
enue grew in all segments, except North America. Revenue
growth was driven by an increase of 7% in Active
Representatives.
On a category basis, the 2008 increase in revenue was primarily
driven by an increase of 10% in Beauty sales, with increases in
all sub-categories of Beauty. Within the Beauty category, fra-
grance grew 9%, color grew 11%, skin care grew 10%, and
personal care grew 8%. Fashion sales increased 6%, while Home
sales decreased 3%.
Total revenue increased 13% in 2007 with growth in all seg-
ments. Revenue growth was driven by an increase of 9% in
Active Representatives, while foreign exchange contributed 5
percentage points to the revenue growth. Additional selling
opportunities in Central & Eastern Europe had a minimal impact
on Active Representative growth.
On a category basis, the 2007 increase in revenue was primarily
driven by an increase of 15% in Beauty sales. Within the Beauty
category, fragrance increased 20%, color increased 16%, skin
care increased 6% and personal care increased 21%. Fashion
sales increased 12% and Home sales increased 6%.
For additional discussion of the changes in revenue by segment,
see the “Segment Review” section of this Management’s Dis-
cussion and Analysis of Financial Condition and Results of
Operations.
Gross Margin
Gross margin increased 2.8 points in 2008, primarily due to a
decrease in inventory obsolescence provisions in 2008, which
benefited gross margin by 2.0 points, and from increased pricing