Avon 2008 Annual Report Download - page 40
Download and view the complete annual report
Please find page 40 of the 2008 Avon annual report below. You can navigate through the pages in the report by either clicking on the pages listed below, or by using the keyword search tool below to find specific information within the annual report.-
 1
1 -
2
-
3
-
4
-
5
-
6
-
7
-
8
-
9
-
10
-
11
-
12
-
13
-
14
-
15
-
16
-
17
-
18
-
19
-
20
-
21
-
22
-
23
-
24
-
25
-
26
-
27
-
28
-
29
-
 30
30 -
 31
31 -
 32
32 -
 33
33 -
 34
34 -
 35
35 -
 36
36 -
 37
37 -
 38
38 -
 39
39 -
 40
40 -
 41
41 -
 42
42 -
 43
43 -
 44
44 -
 45
45 -
 46
46 -
 47
47 -
 48
48 -
 49
49 -
 50
50 -
51
-
52
-
53
-
54
-
55
-
56
-
57
-
58
-
59
-
60
-
61
-
62
-
63
-
64
-
65
-
66
-
67
-
68
-
69
-
70
-
71
-
72
-
73
-
74
-
75
-
76
-
77
-
78
-
79
-
80
-
81
-
82
-
83
-
84
-
85
-
86
-
87
-
88
-
89
-
90
-
91
-
92
 |
 |

PART II
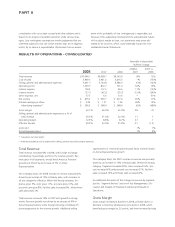
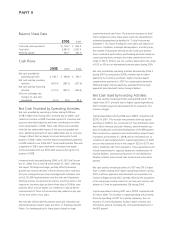
Balance Sheet Data
2008 2007
Cash and cash equivalents $1,104.7 $ 963.4
Total debt 2,487.6 2,097.4
Working capital 644.7 462.0
Cash Flows
2008 2007 2006
Net cash provided by
operating activities $ 748.1 $ 589.8 $ 796.1
Net cash used by investing
activities (403.4) (287.2) (207.9)
Net cash used by financing
activities (141.5) (597.1) (490.4)
Effect of exchange rate
changes on cash and
equivalents (61.9) 59.0 42.4
Net Cash Provided by Operating Activities
Net cash provided by operating activities during 2008 was
$158.3 higher than during 2007, primarily due to higher cash-
related net income in 2008, favorable impacts of inventory and
accounts receivable balances and lower contributions to retire-
ment-related plans in 2008. These cash inflows were partially
offset by the unfavorable impact of the accounts payable bal-
ance, additional payments of value added taxes due to a tax law
change in Brazil that we began to recover during the fourth
quarter of 2008, higher incentive-based compensation payments
in 2008 related to our 2006-2007 Turnaround Incentive Plan and
a payment of $38.0 upon settlement of treasury lock agree-
ments associated with our $500 debt issuance during the first
quarter of 2008.
Inventory levels decreased during 2008, to $1,007.9 at Decem-
ber 31, 2008, from $1,041.8 at December 31, 2007, reflecting
the impact of foreign exchange, partially offset by business
growth and revenue declines in North America. New inventory
life cycle management processes leveraged with initiatives such
as PLS, SSI, ERP implementation and the Sales and Operations
Planning process are expected to improve inventory levels in the
long-term. Inventory days are down three days in 2008 as com-
pared to 2007, and we expect our initiatives to help us deliver
improvements of three to five inventory day reductions per year
for the next three to four years.
We maintain defined benefit pension plans and unfunded sup-
plemental pension benefit plans (see Note 11, Employee Benefit
Plans). Our funding policy for these plans is based on legal
requirements and cash flows. The amounts necessary to fund
future obligations under these plans could vary depending on
estimated assumptions (as detailed in “Critical Accounting
Estimates”). The future funding for these plans will depend on
economic conditions, employee demographics, mortality rates,
the number of associates electing to take lump-sum distribu-
tions, investment performance and funding decisions. Based on
current assumptions, we expect to make contributions in the
range of $60 to $100 to our U.S. pension plans and in the range
of $20 to $30 to our international pension plans during 2009.
Net cash provided by operating activities decreased by $206.3
during 2007 as compared to 2006, primarily due to higher
payments for inventory purchases, higher incentive-based
compensation payments in 2007 for compensation earned in
2006 and higher interest payments, partially offset by lower
payments associated with restructuring initiatives.
Net Cash Used by Investing Activities
Net cash used by investing activities during 2008 was $116.2
higher than 2007, primarily due to higher capital expenditures.
2007 included a payment associated with an acquisition of a
licensee in Egypt.
Capital expenditures during 2008 were $380.5 compared with
$278.5 in 2007. This increase was primarily driven by capital
spending in 2008 for the construction of new distribution facili-
ties in North America and Latin America, and information sys-
tems (including the continued development of the ERP system).
Plant construction, expansion and modernization projects were
in progress at December 31, 2008, with an estimated cost to
complete of approximately $430. Capital expenditures in 2009
are currently expected to be in the range of $325 to $375 and
will be funded by cash from operations. These expenditures will
include investments for capacity expansion, modernization of
existing facilities, continued construction of new distribution
facilities in North America and Latin America and information
systems.
Net cash used by investing activities in 2007 was $79.3 higher
than in 2006 resulting from higher capital expenditures during
2007, and from payments associated with an acquisition of a
licensee in Egypt during 2007, partially offset by the acquisition
of the remaining minority interest in our two joint venture sub-
sidiaries in China for approximately $39 during 2006.
Capital expenditures during 2007 were $278.5 compared with
$174.8 in 2006. The increase in capital spending was primarily
driven by spending in 2007 for capacity expansion, the con-
struction of a new distribution facility in North America and
information systems (including the continued development of
the ERP system).