Avon 2008 Annual Report Download - page 71
Download and view the complete annual report
Please find page 71 of the 2008 Avon annual report below. You can navigate through the pages in the report by either clicking on the pages listed below, or by using the keyword search tool below to find specific information within the annual report.-
 1
1 -
2
-
3
-
4
-
5
-
6
-
7
-
8
-
9
-
10
-
11
-
12
-
13
-
14
-
15
-
16
-
17
-
18
-
19
-
20
-
21
-
22
-
23
-
24
-
25
-
26
-
27
-
28
-
29
-
30
-
31
-
32
-
33
-
34
-
35
-
36
-
37
-
38
-
39
-
40
-
41
-
42
-
43
-
44
-
45
-
46
-
47
-
48
-
49
-
50
-
51
-
52
-
53
-
54
-
55
-
56
-
57
-
58
-
59
-
60
-
 61
61 -
 62
62 -
 63
63 -
 64
64 -
 65
65 -
 66
66 -
 67
67 -
 68
68 -
 69
69 -
 70
70 -
 71
71 -
 72
72 -
 73
73 -
 74
74 -
 75
75 -
 76
76 -
 77
77 -
 78
78 -
 79
79 -
 80
80 -
 81
81 -
82
-
83
-
84
-
85
-
86
-
87
-
88
-
89
-
90
-
91
-
92
 |
 |

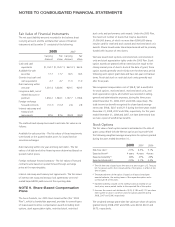
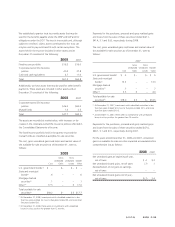
A summary of stock options as of December 31, 2008, and changes during 2008, is as follows:
Shares
(in 000’s)
Weighted-
Average
Exercise
Price
Weighted-
Average
Contractual
Term
Aggregate
Intrinsic
Value
Outstanding at January 1, 2008 22,648 $33.25
Granted 4,081 38.80
Exercised (2,895) 27.34
Forfeited (249) 36.78
Expired (324) 38.43
Outstanding at December 31, 2008 23,261 $34.85 6.2 $4.9
Exercisable at December 31, 2008 17,000 $33.55 5.2 $4.9
Options granted during 2008 include 600,000 of options with a
market condition and we estimated the fair value of these
options using a Monte-Carlo simulation model.
At December 31, 2008, there was approximately $23.6 of
unrecognized compensation cost related to stock options out-
standing. That cost is expected to be recognized over a weighted-
average period of 1.6 years. We recognize expense on stock
options using a graded vesting method, which recognizes the
associated expense based on the timing of option vesting dates.
Cash proceeds, tax benefits, and intrinsic value related to total
stock options exercised during 2008, 2007 and 2006, were
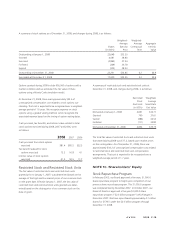
as follows:
2008 2007 2006
Cash proceeds from stock options
exercised $81.4 $85.5 $32.5
Tax benefit realized for stock
options exercised 12.2 16.8 4.1
Intrinsic value of stock options
exercised 41.5 50.5 11.7
Restricted Stock and Restricted Stock Units
The fair value of restricted stock and restricted stock units
granted prior to January 1, 2007, was determined based on the
average of the high and low market prices of our common stock
on the grant date. Effective January 1, 2007, the fair value of
restricted stock and restricted stock units granted was deter-
mined based on the closing price of our common stock on the
date of grant.
A summary of restricted stock and restricted stock units at
December 31, 2008, and changes during 2008, is as follows:
Restricted
Stock
And Units
(in 000’s)
Weighted-
Average
Grant-Date
Fair Value
Nonvested at January 1, 2008 2,691 $34.71
Granted 760 37.61
Vested (486) 34.53
Forfeited (111) 34.83
Nonvested at December 31, 2008 2,854 $35.75
The total fair value of restricted stock and restricted stock units
that vested during 2008 was $17.2, based upon market prices
on the vesting dates. As of December 31, 2008, there was
approximately $34.2 of unrecognized compensation cost related
to restricted stock and restricted stock unit compensation
arrangements. That cost is expected to be recognized over a
weighted-average period of 1.7 years.
NOTE 10. Shareholders’ Equity
Stock Repurchase Program
In February 2005, our Board approved a five-year, $1,000.0
share repurchase program to begin upon completion of our
previous share repurchase program. This $1,000.0 program
was completed during December 2007. In October 2007, our
Board of Directors approved a five-year $2,000.0 share
repurchase program (“$2.0 billion program”) which began in
December 2007. We have repurchased approximately 4.7 million
shares for $178.5 under the $2.0 billion program through
December 31, 2008.
A V O N 2008 F-19