Avon 2008 Annual Report Download - page 74
Download and view the complete annual report
Please find page 74 of the 2008 Avon annual report below. You can navigate through the pages in the report by either clicking on the pages listed below, or by using the keyword search tool below to find specific information within the annual report.-
 1
1 -
2
-
3
-
4
-
5
-
6
-
7
-
8
-
9
-
10
-
11
-
12
-
13
-
14
-
15
-
16
-
17
-
18
-
19
-
20
-
21
-
22
-
23
-
24
-
25
-
26
-
27
-
28
-
29
-
30
-
31
-
32
-
33
-
34
-
35
-
36
-
37
-
38
-
39
-
40
-
41
-
42
-
43
-
44
-
45
-
46
-
47
-
48
-
49
-
50
-
51
-
52
-
53
-
54
-
55
-
56
-
57
-
58
-
59
-
60
-
61
-
62
-
63
-
 64
64 -
 65
65 -
 66
66 -
 67
67 -
 68
68 -
 69
69 -
 70
70 -
 71
71 -
 72
72 -
 73
73 -
 74
74 -
 75
75 -
 76
76 -
 77
77 -
 78
78 -
 79
79 -
 80
80 -
 81
81 -
 82
82 -
 83
83 -
 84
84 -
85
-
86
-
87
-
88
-
89
-
90
-
91
-
92
 |
 |

NOTES TO CONSOLIDATED FINANCIAL STATEMENTS
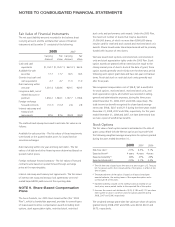
The U.S. pension plans include funded qualified plans and
unfunded non-qualified plans. As of December 31, 2008 and
2007, the U.S. qualified pension plans had benefit obligations of
$635.6 and $683.3, and plan assets of $449.1 and $713.3,
respectively. We believe we have adequate investments and cash
flows to fund the liabilities associated with the unfunded
non-qualified plans.
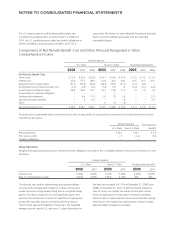
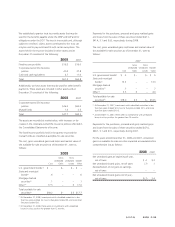
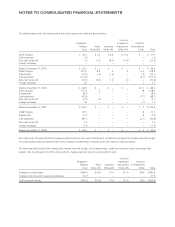
Components of Net Periodic Benefit Cost and Other Amounts Recognized in Other
Comprehensive Income
Pension Benefits
Postretirement BenefitsU.S. Plans Non-U.S. Plans
2008 2007 2006 2008 2007 2006 2008 2007 2006
Net Periodic Benefit Cost:
Service cost $ 17.4 $ 25.4 $ 25.8 $ 16.7 $ 19.4 $ 21.4 $ 3.3 $ 3.5 $ 3.4
Interest cost 45.4 47.3 48.4 41.9 38.2 34.2 10.5 10.2 10.5
Expected return on plan assets (51.7) (53.6) (54.5) (44.3) (39.7) (31.1) (3.3) (2.3) –
Amortization of prior service (credit) cost (1.0) (1.9) (2.2) (1.4) (1.7) .2 (6.0) (6.1) (6.0)
Amortization of actuarial Losses 28.4 36.0 33.1 10.7 13.9 11.5 .9 1.5 1.9
Amortization of transition obligation – – – .1 .1 – – – –
Settlements/curtailments – 4.4 11.2 1.6 (.7) 2.6 – – (2.1)
Special termination benefits – .5 6.3 – – .6 – – 3.3
Other – – – .6 (.7) (.2) – – –
Net periodic benefit cost $ 38.5 $ 58.1 $ 68.1 $ 25.9 $ 28.8 $ 39.2 $ 5.4 $ 6.8 $11.0
The amounts in accumulated other comprehensive loss that are expected to be recognized as components of net periodic benefit cost dur-
ing 2009 are as follows:
Pension Benefits Postretirement
BenefitsU.S. Plans Non-U.S. Plans
Net actuarial loss $32.2 $12.1 $ 2.9
Prior service credit (.1) (1.0) (6.0)
Transition obligation –.1 –
Assumptions
Weighted-average assumptions used to determine benefit obligations recorded on the Consolidated Balance Sheets as of December 31 were
as follows:
Pension Benefits
U.S. Plans Non-U.S. Plans Postretirement Benefits
2008 2007 2008 2007 2008 2007
Discount rate 6.05% 6.20% 6.17% 5.56% 6.23% 6.26%
Rate of compensation increase 4.00% 4.00% 3.51% 3.10% N/A N/A
The discount rate used for determining future pension obliga-
tions for each individual plan is based on a review of long-term
bonds that receive a high-quality rating from a recognized rating
agency. The discount rates for our most significant plans, were
based on the internal rate of return for a portfolio of high-quality
bonds with maturities that are consistent with the projected
future benefit payment obligations of each plan. The weighted-
average discount rate for U.S. and non-U.S. plans determined on
this basis has increased to 6.11% at December 31, 2008, from
5.88% at December 31, 2007. In determining the long-term
rates of return, we consider the nature of each plan’s invest-
ments, an expectation for each plan’s investment strategies,
historical rates of return and current economic forecasts, among
other factors. We evaluate the expected rate of return on plan
assets annually and adjust as necessary.