Avon 2008 Annual Report Download - page 38
Download and view the complete annual report
Please find page 38 of the 2008 Avon annual report below. You can navigate through the pages in the report by either clicking on the pages listed below, or by using the keyword search tool below to find specific information within the annual report.-
 1
1 -
2
-
3
-
4
-
5
-
6
-
7
-
8
-
9
-
10
-
11
-
12
-
13
-
14
-
15
-
16
-
17
-
18
-
19
-
20
-
21
-
22
-
23
-
24
-
25
-
26
-
27
-
 28
28 -
 29
29 -
 30
30 -
 31
31 -
 32
32 -
 33
33 -
 34
34 -
 35
35 -
 36
36 -
 37
37 -
 38
38 -
 39
39 -
 40
40 -
 41
41 -
 42
42 -
 43
43 -
 44
44 -
 45
45 -
 46
46 -
 47
47 -
 48
48 -
49
-
50
-
51
-
52
-
53
-
54
-
55
-
56
-
57
-
58
-
59
-
60
-
61
-
62
-
63
-
64
-
65
-
66
-
67
-
68
-
69
-
70
-
71
-
72
-
73
-
74
-
75
-
76
-
77
-
78
-
79
-
80
-
81
-
82
-
83
-
84
-
85
-
86
-
87
-
88
-
89
-
90
-
91
-
92
 |
 |

PART II
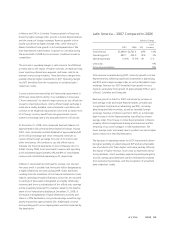
added tax dispute in the U.K. in the third quarter of 2006. The
increase in operating margin for 2007 was also driven by lower
product costs due to favorable foreign exchange movements and
savings associated with position eliminations resulting from re-
structuring initiatives. These benefits to operating margin were
partially offset by higher costs to implement restructuring ini-
tiatives, which negatively impacted operating margin by 1.1
points in 2007, higher spending on advertising and RVP and
higher inventory obsolescence expense.
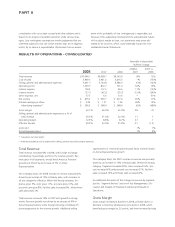
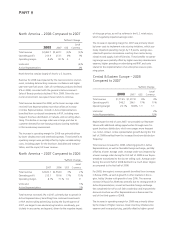
Asia Pacific – 2008 Compared to 2007
%/Point Change
2008 2007 US$
Local
Currency
Total revenue $891.2 $850.8 5% 0%
Operating profit 102.4 64.3 59% 54%
Operating margin 11.5% 7.6% 3.9 4.0
Units sold 0%
Active Representatives 4%
Total revenue increased for 2008 due to foreign exchange. Re-
venue growth in the Philippines of almost 20%, was primarily
due to growth in Active Representatives, supported by RVP ini-
tiatives, as well as favorable foreign exchange. Revenue in Japan
increased slightly due to foreign exchange. Revenue in Japan in
local currency declined in 2008 due to lower sales from both
direct mail and direct selling. We expect to continue to see
downward pressure in Japan going forward. Revenue in Taiwan
declined in 2008, reflecting the impact of a field restructuring
and economic weakness, partially offset by favorable
foreign exchange.
Operating margin increased for 2008, primarily due to the im-
pact of lower inventory obsolescence expense, increased pricing
and lower overhead expenses, partially offset by higher spending
on RVP and an unfavorable mix of products sold.
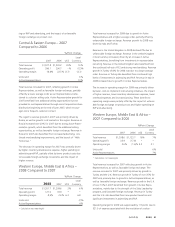
Asia Pacific – 2007 Compared to 2006
%/Point Change
2007 2006 US$
Local
Currency
Total revenue $850.8 $810.8 5% (1)%
Operating profit 64.3 42.5 51% 35%
Operating margin 7.6% 5.2% 2.4 1.9
Units sold 2%
Active Representatives 4%
Total revenue increased for 2007 due to favorable foreign ex-
change. The region’s revenue increase for 2007 was primarily
driven by growth in the Philippines, partially offset by declines in
Japan and Taiwan. Revenue in the Philippines for 2007 increased
almost 30%, driven by substantial growth in Active Representa-
tives, supported by RVP initiatives, including the roll-out of the
Sales Leadership program nationwide, and investments in re-
cruiting advertising, as well as favorable foreign exchange. Rev-
enue in Japan declined mid-single digits for 2007, reflecting
weak performance in skin care. In Japan, lower sales from direct
mailing were partially offset by a modest increase in sales from
direct selling. While less than the overall revenue decline in the
beauty market, revenue in Taiwan declined due to economic
weakness.
The increase in operating margin for 2007 was primarily driven
by lower costs to implement restructuring initiatives, which pos-
itively impacted operating margin by 2.2 points. Additionally,
the operating margin improvement was due to lower inventory
obsolescence expense and savings associated with position
eliminations resulting from restructuring initiatives, partially off-
set by higher spending on RVP and advertising and unfavorable
category and country mixes of products sold.
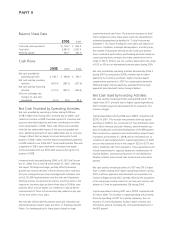
China – 2008 Compared to 2007
%/Point Change
2008 2007 US$
Local
Currency
Total revenue $350.9 $280.5 25% 14%
Operating profit 17.7 2.0 * *
Operating margin 5.0% .7% 4.3 4.1
Units sold 2%
Active Representatives 79%
* Calculation not meaningful
Revenue in China increased for 2008, primarily due to an in-
crease in Active Representatives, partially offset by a lower
average order. The growth in Active Representatives reflected
continued expansion of our direct selling efforts, which were
supported with significant Representative recruiting, television
advertising and field incentives. The lower average order resulted
from the continued expansion of direct selling, as Representa-
tives order in smaller quantities than beauty boutiques, and
orders from new Representatives tend to be smaller than the
average direct selling order. Beauty boutique ordering activity
levels have remained steady during this extended period of direct
selling expansion, as our beauty boutique operators continue to
service our Representatives.