Avon 2008 Annual Report Download - page 36
Download and view the complete annual report
Please find page 36 of the 2008 Avon annual report below. You can navigate through the pages in the report by either clicking on the pages listed below, or by using the keyword search tool below to find specific information within the annual report.-
 1
1 -
2
-
3
-
4
-
5
-
6
-
7
-
8
-
9
-
10
-
11
-
12
-
13
-
14
-
15
-
16
-
17
-
18
-
19
-
20
-
21
-
22
-
23
-
24
-
25
-
 26
26 -
 27
27 -
 28
28 -
 29
29 -
 30
30 -
 31
31 -
 32
32 -
 33
33 -
 34
34 -
 35
35 -
 36
36 -
 37
37 -
 38
38 -
 39
39 -
 40
40 -
 41
41 -
 42
42 -
 43
43 -
 44
44 -
 45
45 -
 46
46 -
47
-
48
-
49
-
50
-
51
-
52
-
53
-
54
-
55
-
56
-
57
-
58
-
59
-
60
-
61
-
62
-
63
-
64
-
65
-
66
-
67
-
68
-
69
-
70
-
71
-
72
-
73
-
74
-
75
-
76
-
77
-
78
-
79
-
80
-
81
-
82
-
83
-
84
-
85
-
86
-
87
-
88
-
89
-
90
-
91
-
92
 |
 |

PART II
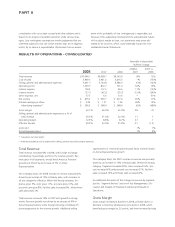
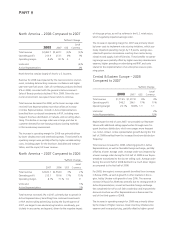
North America – 2008 Compared to 2007
%/Point Change
2008 2007 US$
Local
Currency
Total revenue $2,492.7 $2,622.1 (5)% (5)%
Operating profit 213.9 213.1 0% 1%
Operating margin 8.6% 8.1% .5 .5
Units sold (4)%
Active Representatives 2%
North America consists largely of Avon’s U.S. business.
Revenue for 2008 was impacted by the macroeconomic environ-
ment, including deteriorating consumer confidence and higher
year-over-year fuel prices. Sales of non-Beauty products declined
9% in 2008, consistent with the general retail environment.
Sales of Beauty products declined 1% in 2008. Given the eco-
nomic environment, we expect these trends to continue.
Total revenue decreased for 2008, as the lower average order
received from Representatives more than offset an increase
in Active Representatives. Growth in Active Representatives
benefited from continued investments in RVP, including more
frequent brochure distribution in Canada, and recruiting adver-
tising. The decline in average order was in large part due to
customer demand for non-beauty products slowing markedly
in this recessionary environment.
The increase in operating margin for 2008 was primarily driven
by lower obsolescence and overhead expenses. These benefits to
operating margin were partially offset by higher variable selling
costs, including paper for the brochure, bad debt and transpor-
tation, and the impact of lower revenue.
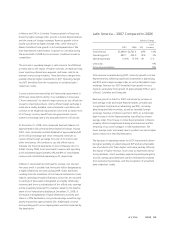
North America – 2007 Compared to 2006
%/Point Change
2007 2006 US$
Local
Currency
Total revenue $2,622.1 $2,554.0 3% 2%
Operating profit 213.1 181.6 17% 15%
Operating margin 8.1% 7.1% 1.0 .9
Units sold 3%
Active Representatives 3%
Total revenue increased 3% in 2007, primarily due to growth in
Active Representatives, benefiting from continued investments
in RVP and recruiting advertising. During the fourth quarter of
2007, we began to see decelerating trends in non-Beauty, par-
ticularly in accessories and apparel, driven by the negative impact
of rising gas prices, as well as softness in the U.S. retail sector,
which negatively impacted average order.
The increase in operating margin for 2007 was primarily driven
by lower costs to implement restructuring initiatives, which pos-
itively impacted operating margin by 1.9 points, savings asso-
ciated with position eliminations resulting from restructuring
initiatives and supply chain efficiencies. These benefits to operat-
ing margin were partially offset by higher inventory obsolescence
expense, higher spending on advertising and RVP, and costs
related to the implementation of an enterprise resource plan-
ning system.
Central & Eastern Europe – 2008
Compared to 2007
%/Point Change
2008 2007 US$
Local
Currency
Total revenue $1,719.5 $1,577.8 9% 4%
Operating profit 346.2 296.1 17% 11%
Operating margin 20.1% 18.8% 1.3 1.1
Units sold 2%
Active Representatives 12%
Beginning at the end of June 2007, we provided our Represen-
tatives with additional selling opportunities through more fre-
quent brochure distribution, which encourages more frequent
cus- tomer contact. Active representative growth during the first
half of 2008 benefited from the increased brochure distribution
frequency.
Total revenue increased for 2008, reflecting growth in Active
Representatives, as well as favorable foreign exchange, partially
offset by a lower average order. Average order was impacted by
a lower average order during the first half of 2008 as our Repre-
sentatives transitioned to the shorter selling cycle. Average order
during the second half of 2008 declined to a much lesser degree
as compared to the first half of 2008.
For 2008, the region’s revenue growth benefited from increases
in Russia of 8%, as well as growth in other markets in the re-
gion, led by Ukraine with growth of over 20%. The revenue
increase in Russia for 2008 was primarily due to strong growth in
Active Representatives, as well as favorable foreign exchange.
We completed the roll-out of Sales Leadership and improved the
discount structure we offer Representatives in Russia near the
end of the third quarter of 2008.
The increase in operating margin for 2008 was primarily driven
by the impact of higher revenue, lower inventory obsolescence
expense and increased pricing, partially offset by higher spend-