3M 2008 Annual Report Download - page 77
Download and view the complete annual report
Please find page 77 of the 2008 3M annual report below. You can navigate through the pages in the report by either clicking on the pages listed below, or by using the keyword search tool below to find specific information within the annual report.-
 1
1 -
2
-
3
-
4
-
5
-
6
-
7
-
8
-
9
-
10
-
11
-
12
-
13
-
14
-
15
-
16
-
17
-
18
-
19
-
20
-
21
-
22
-
23
-
24
-
25
-
26
-
27
-
28
-
29
-
30
-
31
-
32
-
33
-
34
-
35
-
36
-
37
-
38
-
39
-
40
-
41
-
42
-
43
-
44
-
45
-
46
-
47
-
48
-
49
-
50
-
51
-
52
-
53
-
54
-
55
-
56
-
57
-
58
-
59
-
60
-
61
-
62
-
63
-
64
-
65
-
66
-
 67
67 -
 68
68 -
 69
69 -
 70
70 -
 71
71 -
 72
72 -
 73
73 -
 74
74 -
 75
75 -
 76
76 -
 77
77 -
 78
78 -
 79
79 -
 80
80 -
 81
81 -
 82
82 -
 83
83 -
 84
84 -
 85
85 -
 86
86 -
 87
87 -
88
-
89
-
90
-
91
-
92
-
93
-
94
-
95
-
96
-
97
-
98
-
99
-
100
-
101
-
102
-
103
-
104
-
105
-
106
-
107
-
108
-
109
-
110
-
111
-
112
 |
 |

71
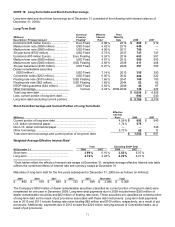
NOTE 10. Long-Term Debt and Short-Term Borrowings
Long-term debt and short-term borrowings as of December 31 consisted of the following (with interest rates as of
December 31, 2008):
Long-Term Debt
(Millions)
Description / Principal Amount
Currency/
Fixed vs.
Floating*
Effective
Interest
Rate*
Final
Maturity
Date 2008 2007
Eurobond (625 million Euros)...................... Euro Fixed 4.98 % 2014
$ 882 $ 919
Medium-term note ($850 million) ................ USD Fixed 4.42 % 2013
849 —
Medium-term note ($800 million) ................ USD Fixed 4.56 % 2011
799 —
30-year bond ($750 million) ........................ USD Fixed 5.73 % 2037
747 747
Eurobond (400 million Euros)...................... Euro Floating 5.24 % 2014
603 591
Medium-term note ($500 million) ................ USD Fixed 4.67 % 2012
500 500
Medium-term note ($400 million) ................ USD Floating 2.68 % 2009
411 408
30-year debenture ($330 million) ................ USD Fixed 6.01 % 2028
351 350
Dealer remarketable securities
($350 million) ........................................... USD Fixed 7.14 % 2010
350 350
Convertible notes ($252 million).................. USD Fixed 0.50 % 2032
224 222
Floating rate note ($100 million).................. USD Floating 1.65 % 2041
100 100
Floating rate note ($62 million).................... USD Floating 1.65 % 2044
62 62
ESOP debt guarantee ($44 million) ............ USD Fixed 5.62 % 2009
44 87
Other borrowings......................................... Various 4.44 % 2009-2040
136 223
Total long-term debt ....................................
$ 6,058 $ 4,559
Less: current portion of long-term debt .......
892 540
Long-term debt (excluding current portion).
$ 5,166 $ 4,019
Short-Term Borrowings and Current Portion of Long-Term Debt
(Millions)
Effective
Interest
Rate* 2008 2007
Current portion of long-term debt ................................................... 4.59 % $ 892 $ 540
U.S. dollar commercial paper......................................................... 1.74 % 575 —
Non-U.S. dollar commercial paper................................................. — — 349
Other borrowings............................................................................ 5.73 % 85 12
Total short-term borrowings and current portion of long-term debt
$ 1,552 $ 901
Weighted-Average Effective Interest Rate*
Total Excluding ESOP Debt
At December 31 2008 2007 2008 2007
Short-term .................................................... 3.59 % 5.10 % 3.53 % 5.07 %
Long-term ..................................................... 4.72 % 4.48 % 4.72 % 4.47 %
* Debt tables reflect the effects of interest rate swaps at December 31; weighted-average effective interest rate table
reflects the combined effects of interest rate and currency swaps at December 31.
Maturities of long-term debt for the five years subsequent to December 31, 2008 are as follows (in millions):
2009 2010 2011 2012 2013 Thereafter Total
$ 892 $ 109 $ 899 $ 723 $ 849 $ 2,586 $ 6,058
The Company’s $350 million of dealer remarketable securities (classified as current portion of long-term debt) were
remarketed for one year in December 2008. Long-term debt payments due in 2009 include these $350 million of
dealer remarketable securities and $62 million of floating rate notes. These securities are classified as current portion
of long-term debt as the result of put provisions associated with these debt instruments. Long-term debt payments
due in 2010 and 2011 include floating rate notes totaling $85 million and $100 million, respectively, as a result of put
provisions. Additionally, payments due in 2012 include the $224 million carrying amount of Convertible Notes, as a
result of put provisions.