3M 2008 Annual Report Download - page 22
Download and view the complete annual report
Please find page 22 of the 2008 3M annual report below. You can navigate through the pages in the report by either clicking on the pages listed below, or by using the keyword search tool below to find specific information within the annual report.-
 1
1 -
2
-
3
-
4
-
5
-
6
-
7
-
8
-
9
-
10
-
11
-
 12
12 -
 13
13 -
 14
14 -
 15
15 -
 16
16 -
 17
17 -
 18
18 -
 19
19 -
 20
20 -
 21
21 -
 22
22 -
 23
23 -
 24
24 -
 25
25 -
 26
26 -
 27
27 -
 28
28 -
 29
29 -
 30
30 -
 31
31 -
 32
32 -
33
-
34
-
35
-
36
-
37
-
38
-
39
-
40
-
41
-
42
-
43
-
44
-
45
-
46
-
47
-
48
-
49
-
50
-
51
-
52
-
53
-
54
-
55
-
56
-
57
-
58
-
59
-
60
-
61
-
62
-
63
-
64
-
65
-
66
-
67
-
68
-
69
-
70
-
71
-
72
-
73
-
74
-
75
-
76
-
77
-
78
-
79
-
80
-
81
-
82
-
83
-
84
-
85
-
86
-
87
-
88
-
89
-
90
-
91
-
92
-
93
-
94
-
95
-
96
-
97
-
98
-
99
-
100
-
101
-
102
-
103
-
104
-
105
-
106
-
107
-
108
-
109
-
110
-
111
-
112
 |
 |

16
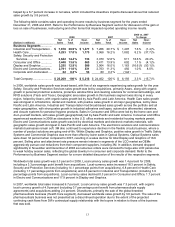
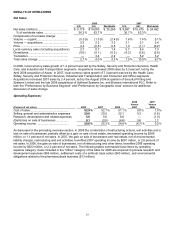
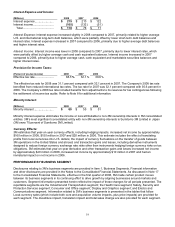
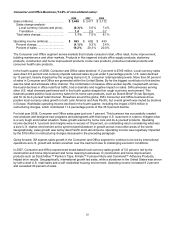
RESULTS OF OPERATIONS
Net Sales:
2008 2007
U.S. Intl. Worldwide U.S. Intl. Worldwide
Net sales (millions)...................................... $ 9,179 $ 16,090 $ 25,269 $ 8,987 $ 15,475 $ 24,462
% of worldwide sales ............................... 36.3 % 63.7 % 36.7 % 63.3 %
Components of net sales change:
Volume — organic....................................... (5.0 )% (1.0 )% (2.4 )% 1.6 % 7.4 % 5.1 %
Volume — acquisitions................................ 5.3 2.2 3.3 3.1 2.1 2.4
Price ............................................................ 2.4 (0.5 ) 0.5 1.0 (1.1 ) (0.2 )
Local-currency sales (including acquisitions) 2.7 0.7 1.4 5.7 8.4 7.3
Divestitures.................................................. (0.6 ) (0.1 ) (0.3 ) (4.2 ) (3.6 ) (3.8 )
Translation................................................... — 3.4 2.2 — 5.2 3.2
Total sales change ...................................... 2.1 % 4.0 % 3.3 % 1.5 % 10.0 % 6.7 %
In 2008, local-currency sales growth of 1.4 percent was led by the Safety, Security and Protection Services; Health
Care; and Industrial and Transportation segments. Acquisitions increased 2008 sales by 3.3 percent, led by the
April 2008 acquisition of Aearo. In 2007, local-currency sales growth of 7.3 percent was led by the Health Care;
Safety, Security and Protection Services; Industrial and Transportation and Consumer and Office segments.
Acquisitions increased 2007 sales by 2.4 percent, led by the August 2006 acquisition of Security Printing and
Systems Limited and the late 2006 acquisitions of Softmed Systems Inc. and Biotrace International PLC. Refer to
both the “Performance by Business Segment” and “Performance by Geographic Area” sections for additional
discussion of sales change.
Operating Expenses:
2008 2007
Versus Versus
(Percent of net sales) 2008 2007 2006 2007 2006
Cost of sales................................................. 52.9 % 52.1 % 51.1 % 0.8 % 1.0 %
Selling, general and administrative expenses 20.8 20.5 22.1 0.3 (1.6 )
Research, development and related expenses 5.6 5.6 6.6 — (1.0 )
(Gain)/loss on sale of businesses ................ 0.1 (3.5 ) (4.6 ) 3.6 1.1
Operating income......................................... 20.6 % 25.3 % 24.8 % (4.7 )% 0.5 %
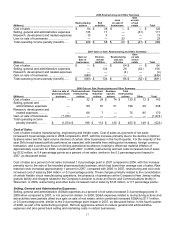
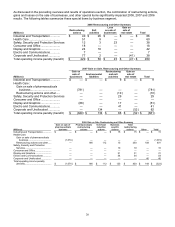
As discussed in the preceding overview section, in 2008 the combination of restructuring actions, exit activities and a
loss on sale of businesses, partially offset by a gain on sale of real estate, decreased operating income by $269
million, or 1.1 percent of net sales. In 2007, the gain on sale of businesses and real estate, net of environmental
liability charges, restructuring and exit activities, benefited 2007 operating income by $681 million, or 2.8 percent of
net sales. In 2006, the gain on sale of businesses, net of restructuring and other items, benefited 2006 operating
income by $523 million, or 2.2 percent of net sales. The following tables summarize these items by operating
expense category. Items included in the “Other” category of the table for 2006 are acquired in-process research and
development expenses ($95 million), settlement costs of a antitrust class action ($40 million), and environmental
obligations related to the pharmaceuticals business ($13 million).