3M 2008 Annual Report Download - page 35
Download and view the complete annual report
Please find page 35 of the 2008 3M annual report below. You can navigate through the pages in the report by either clicking on the pages listed below, or by using the keyword search tool below to find specific information within the annual report.-
 1
1 -
2
-
3
-
4
-
5
-
6
-
7
-
8
-
9
-
10
-
11
-
12
-
13
-
14
-
15
-
16
-
17
-
18
-
19
-
20
-
21
-
22
-
23
-
24
-
 25
25 -
 26
26 -
 27
27 -
 28
28 -
 29
29 -
 30
30 -
 31
31 -
 32
32 -
 33
33 -
 34
34 -
 35
35 -
 36
36 -
 37
37 -
 38
38 -
 39
39 -
 40
40 -
 41
41 -
 42
42 -
 43
43 -
 44
44 -
 45
45 -
46
-
47
-
48
-
49
-
50
-
51
-
52
-
53
-
54
-
55
-
56
-
57
-
58
-
59
-
60
-
61
-
62
-
63
-
64
-
65
-
66
-
67
-
68
-
69
-
70
-
71
-
72
-
73
-
74
-
75
-
76
-
77
-
78
-
79
-
80
-
81
-
82
-
83
-
84
-
85
-
86
-
87
-
88
-
89
-
90
-
91
-
92
-
93
-
94
-
95
-
96
-
97
-
98
-
99
-
100
-
101
-
102
-
103
-
104
-
105
-
106
-
107
-
108
-
109
-
110
-
111
-
112
 |
 |

29
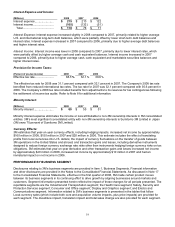
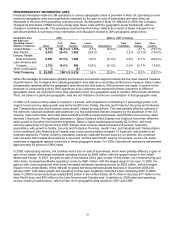
PERFORMANCE BY GEOGRAPHIC AREA
Financial information related to 3M operations in various geographic areas is provided in Note 18. Operating income
results by geographic area were significantly impacted by the gain on sale of businesses and other items as
discussed at the end of the preceding overview section. As discussed in Note 18, effective in 2008, the Company
changed its allocations of R&D to more closely align these costs with the geographic areas that benefit, with no
change in worldwide results. The operating income presented herein reflects the impact of these changes for all
periods presented. A summary of key information and discussion related to 3M’s geographic areas follow:
Geographic Area 2008 2008 vs. 2007 % Change
Net Sales and
Operating Income % of Oper. Local Total Sales Oper.
(Dollars in millions) Sales Total Income Currency Divestitures Translation Change Income
United States........
.
$ 9,179 36.3 % $ 1,578 2.7 % (0.6 )% — 2.1 % (16.7 )%
Asia Pacific...........
.
6,423 25.4 % 1,662 (5.9 )% — 3.2 % (2.7 )% (19.4 )%
Europe, Middle
East and Africa .
.
6,941 27.5 % 1,294 2.8 % (0.1 )% 4.0 % 6.7 % (20.4 )%
Latin America and
Canada .............
.
2,723 10.8 % 693 12.8 % (0.1 )% 2.4 % 15.1 % 12.6 %
Other Unallocated
.
3
—
(9 )
Total Company ...
.
$ 25,269 100 % $ 5,218 1.4 % (0.3 )% 2.2 % 3.3 % (15.7 )%
While 3M manages its businesses globally and believes its business segment results are the most relevant measure
of performance, the Company also utilizes geographic area data as a secondary performance measure. Export sales
are generally reported within the geographic area where the final sales to 3M customers are made. A portion of the
products or components sold by 3M’s operations to its customers are exported by these customers to different
geographic areas. As customers move their operations from one geographic area to another, 3M’s results will follow.
Thus, net sales in a particular geographic area are not indicative of end-user consumption in that geographic area.
In 2008, U.S. local-currency sales increased 2.7 percent, with acquisitions contributing 5.3 percentage points. U.S.
organic local-currency sales growth was led by Health Care. Safety, Security and Protection Services and Industrial
and Transportation also drove positive sales growth, helped by acquisitions. This was partially offset by softness in
the electronic solutions business and weakness in a few businesses that are impacted by the slowdown in the U.S.
housing, road construction and mass retail markets and office supply businesses. Asia Pacific local-currency sales
declined 5.9 percent. The significant decrease in Optical Systems within Display and Graphics more than offset the
sales growth in the other five business segments. Sales in Japan totaled approximately $2.2 billion, with local-
currency sales down 5.2 percent from 2007. Europe local-currency sales increased 2.8 percent, helped by
acquisitions, with growth in Safety, Security and Protection Services, Health Care, and Industrial and Transportation.
In the combined Latin America and Canada area, local-currency sales increased 12.8 percent, with growth in all
business segments. Foreign currency translation positively impacted Europe sales by 4.0 percent, the combined
Latin America and Canada area sales by 2.4 percent, and the Asia Pacific area by 3.2 percent, as the U.S. dollar
weakened in aggregate against currencies in these geographic areas. For 2008, international operations represented
approximately 64 percent of 3M’s sales.
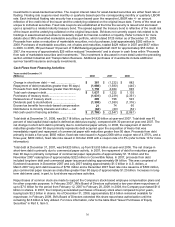
In 2008, restructuring actions, exit activities and a loss on sale of businesses, which were partially offset by a gain on
sale of real estate, decreased worldwide operating income by $269 million, with the largest impact in the United
States and Europe. In 2007, the gain on sale of businesses and a gain on sale of real estate, net of restructuring and
other items, increased worldwide operating income by $681 million, with the largest impact in Europe. In 2006, the
gain on sale, restructuring and other items increased worldwide operating income by $523 million, with the largest
impact in the United States. Since 3M sold its global branded pharmaceuticals business in December 2006 and
January 2007, both sales growth and operating income were negatively impacted when comparing 2007 to 2006.
Sales in 2006 for pharmaceuticals totaled $332 million in the United States, $315 million in Europe, $77 million in the
Asia Pacific area, and $50 million in the Latin America and Canada area. In addition to 2008 sales and operating
income results provided above, refer to Note 18 for geographic area results for 2007 and 2006.