3M 2008 Annual Report Download - page 24
Download and view the complete annual report
Please find page 24 of the 2008 3M annual report below. You can navigate through the pages in the report by either clicking on the pages listed below, or by using the keyword search tool below to find specific information within the annual report.-
 1
1 -
2
-
3
-
4
-
5
-
6
-
7
-
8
-
9
-
10
-
11
-
12
-
13
-
 14
14 -
 15
15 -
 16
16 -
 17
17 -
 18
18 -
 19
19 -
 20
20 -
 21
21 -
 22
22 -
 23
23 -
 24
24 -
 25
25 -
 26
26 -
 27
27 -
 28
28 -
 29
29 -
 30
30 -
 31
31 -
 32
32 -
 33
33 -
 34
34 -
35
-
36
-
37
-
38
-
39
-
40
-
41
-
42
-
43
-
44
-
45
-
46
-
47
-
48
-
49
-
50
-
51
-
52
-
53
-
54
-
55
-
56
-
57
-
58
-
59
-
60
-
61
-
62
-
63
-
64
-
65
-
66
-
67
-
68
-
69
-
70
-
71
-
72
-
73
-
74
-
75
-
76
-
77
-
78
-
79
-
80
-
81
-
82
-
83
-
84
-
85
-
86
-
87
-
88
-
89
-
90
-
91
-
92
-
93
-
94
-
95
-
96
-
97
-
98
-
99
-
100
-
101
-
102
-
103
-
104
-
105
-
106
-
107
-
108
-
109
-
110
-
111
-
112
 |
 |
18
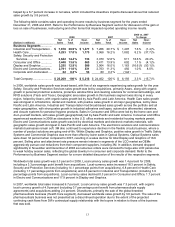
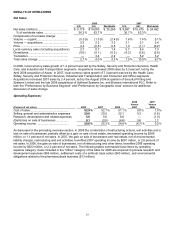
SG&A expenses as a percent of net sales decreased 1.6 percentage points in 2007 when compared to 2006, as
expenses incurred in 2006 in the Company’s now-divested global branded pharmaceuticals business did not repeat
in 2007. Non-pharmaceutical ongoing SG&A expenses, after adjusting for the following items, were up approximately
7 percent in dollars, as the Company invested in sales and marketing to support growth markets. In 2007, SG&A
includes increases in environmental liabilities, restructuring charges and exit activities, net of the gain on sale of real
estate ($108 million combined net expense), which increased SG&A as a percent of sales by 0.4 percentage points.
2006 included restructuring actions and settlement costs of a previously disclosed antitrust class action ($238 million
combined expense), which increased 2006 SG&A as a percent of sales by 1.0 percentage points. In dollars, SG&A
decreased $51 million when comparing 2007 to 2006, with the change in restructuring and other items year-on-year
decreasing SG&A by $130 million, pharmaceutical SG&A spending decreasing $241 million and other SG&A
spending increasing $320 million, or approximately 7 percent in dollars.
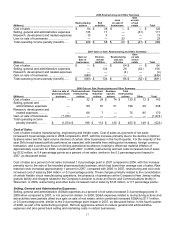
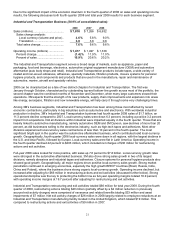
Research, Development and Related Expenses:
Research, development and related expenses (R&D) in 2008 as a percent of net sales was 5.6 percent, the same as
in 2007, while spending in dollars increased. 3M’s long-term commitment to R&D is unchanged, but in the current
economic environment 3M is closely scrutinizing all discretionary investments.
R&D as a percent of net sales decreased 1.0 percentage point in 2007 when compared to 2006, as expenses
incurred in 2006 in the Company’s now-divested R&D-intensive pharmaceuticals business did not repeat in 2007.
Non-pharmaceutical ongoing R&D expenses, after adjusting for the following items, were up approximately 11
percent in dollars, as the Company invested in future technologies and growth opportunities. 2006 spending included
a $95 million in-process research and development charge (discussed in Note 2) and $75 million in restructuring
actions (Note 4), which increased 2006 R&D as a percent of sales by 0.7 percentage points. In dollars, R&D
spending decreased $154 million when comparing 2007 to 2006, with the change in restructuring and other items
year-on-year decreasing R&D by $174 million, 2006 pharmaceutical SG&A spending decreasing $120 million and
other R&D spending increasing $140 million, or approximately 11 percent in dollars.
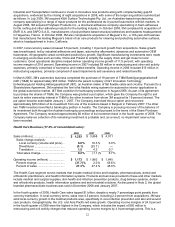
Gain/Loss on Sale of Businesses:
In June 2008, 3M completed the sale of HighJump Software, a 3M Company, to Battery Ventures, a technology
venture capital and private equity firm. 3M received proceeds of $85 million for this transaction and recognized, net of
assets sold, transaction and other costs, a pre-tax loss of $23 million (recorded in the Safety, Security and Protection
Services segment) in the second quarter of 2008.
In January 2007, 3M completed the sale of its global branded pharmaceuticals business in Europe to Meda AB. 3M
received proceeds of $817 million for this transaction and recognized, net of assets sold, a pre-tax gain of $781
million in 2007 (recorded in the Health Care segment). In June 2007, 3M completed the sale of its Opticom Priority
Control Systems and Canoga Traffic Detection businesses to TorQuest Partners Inc., a Toronto-based investment
firm. 3M received proceeds of $80 million for this transaction and recognized, net of assets sold, transaction and
other costs, a pre-tax gain of $68 million (recorded in the Display and Graphics segment) in 2007.
In December 2006, 3M completed the sale of its global branded pharmaceuticals businesses in the United States,
Canada, and Latin America region and the Asia Pacific region, including Australia and South Africa. 3M received
proceeds of $1.209 billion for these transactions and recognized a pre-tax gain on sale of $1.074 billion in 2006
(recorded in the Health Care segment). For more detail, refer to Note 2.
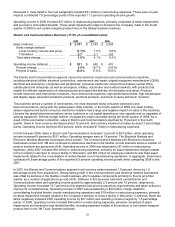
Operating Income:
3M uses operating income as one of its primary business segment performance measurement tools. Operating
income decreased in 2008 to 20.6 percent of sales, negatively impacted by restructuring actions, exit activities and a
loss on sale of businesses that were partially offset by a gain on sale of real estate, which combined decreased
operating income by 1.1 percentage points ($269 million). Operating income margins of 25.3 percent in 2007 were
positively impacted by 2.8 percentage points ($681 million) from the gain on sale of businesses and real estate, net
of environmental liabilities, restructuring and other exit activities. Operating income margins of 24.8 percent for 2006
were positively impacted by 2.2 percentage points ($523 million) from the gain on sale of portions of the
pharmaceuticals business, net of restructuring and other actions. Adjusting for the preceding items, operating income
margins in 2007 were similar to 2006.