3M 2008 Annual Report Download - page 20
Download and view the complete annual report
Please find page 20 of the 2008 3M annual report below. You can navigate through the pages in the report by either clicking on the pages listed below, or by using the keyword search tool below to find specific information within the annual report.-
 1
1 -
2
-
3
-
4
-
5
-
6
-
7
-
8
-
9
-
 10
10 -
 11
11 -
 12
12 -
 13
13 -
 14
14 -
 15
15 -
 16
16 -
 17
17 -
 18
18 -
 19
19 -
 20
20 -
 21
21 -
 22
22 -
 23
23 -
 24
24 -
 25
25 -
 26
26 -
 27
27 -
 28
28 -
 29
29 -
 30
30 -
31
-
32
-
33
-
34
-
35
-
36
-
37
-
38
-
39
-
40
-
41
-
42
-
43
-
44
-
45
-
46
-
47
-
48
-
49
-
50
-
51
-
52
-
53
-
54
-
55
-
56
-
57
-
58
-
59
-
60
-
61
-
62
-
63
-
64
-
65
-
66
-
67
-
68
-
69
-
70
-
71
-
72
-
73
-
74
-
75
-
76
-
77
-
78
-
79
-
80
-
81
-
82
-
83
-
84
-
85
-
86
-
87
-
88
-
89
-
90
-
91
-
92
-
93
-
94
-
95
-
96
-
97
-
98
-
99
-
100
-
101
-
102
-
103
-
104
-
105
-
106
-
107
-
108
-
109
-
110
-
111
-
112
 |
 |
14
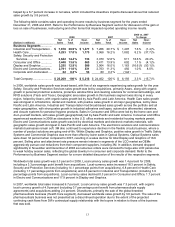
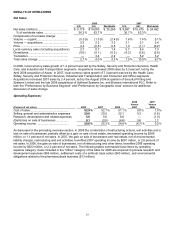
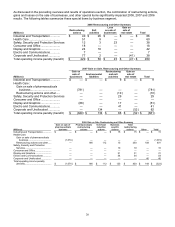
Geographically, Latin America and Canada led local-currency sales growth in 2008, with a combined increase of 12.8
percent, followed by Europe, Middle East and Africa (hereafter referred to as Europe) with a 2.8 percent increase and
the United States with a 2.7 percent increase. Local-currency sales in Asia Pacific declined 5.9 percent. Asia Pacific
was negatively impacted by Optical Systems sales, which were down 34 percent in that region. Excluding Optical
Systems, Asia Pacific sales increased nearly 6 percent on a local-currency basis. Of the local-currency sales growth,
acquisitions contributed 3.2 percent to the combined Latin America and Canada, 3.2 percent to Europe, 5.3 percent
to the United States, and 0.8 percent to Asia Pacific. Foreign currency translation positively impacted international
sales by 3.4 percent, as the U.S. dollar weakened in aggregate against many currencies in these geographic areas.
Foreign currency translation positively impacted Latin America and Canada by 2.4 percent, Europe by 4.0 percent
and Asia Pacific by 3.2 percent. In the fourth quarter of 2008, foreign currency negatively impacted international
sales by 7.5 percent. While difficult to predict given the current exchange rate volatility, foreign currency is also
expected to have a significant negative impact in 2009.
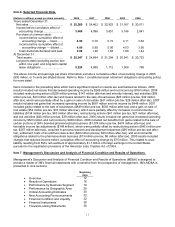
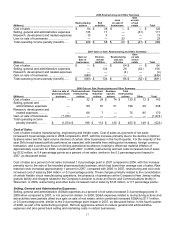
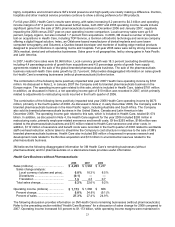
Worldwide operating income for 2008 decreased 15.7 percent year-on-year, with most of this impact due to the year-
on-year change in special items discussed at the end of this overview. In the preceding table, Health Care operating
income in 2007 included significant gains related to the sale of portions of its pharmaceuticals business in 2007,
negatively impacting the 2008 versus 2007 year-on-year comparisons for this business segment. Worldwide
operating income margins were 20.6 percent in 2008, including a 1.1 percent penalty from special items in 2008.
Operating income for 2007 increased 8.7 percent year-on-year, including a net 2.2 percentage point benefit from the
impact of items discussed in “Special Items” below. Operating income margins were approximately 25 percent in
both 2007 and 2006, with special items positively impacting these margins in both years by approximately 2.5
percentage points.
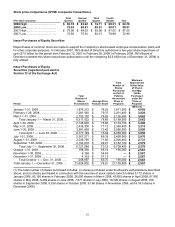
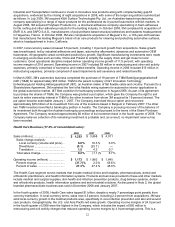
3M generated $4.533 billion of operating cash flow in 2008, an increase of $258 million compared to 2007, which
followed an increase of $436 million when comparing 2007 to 2006. In 2008, 2007 and 2006, the Company utilized
approximately $1.4 billion of cash each year to pay dividends. In 2008, repurchases of 3M common stock totaled
approximately $1.6 billion, compared to $3.2 billion in 2007 and $2.4 billion in 2006. In February 2007, 3M’s Board of
Directors authorized a two-year share repurchase of up to $7.0 billion for the period from February 12, 2007 to
February 28, 2009. As of December 31, 2008, approximately $2.6 billion remained available for repurchase. In
February 2009, 3M’s Board of Directors extended this share repurchase authorization until the remaining $2.6 billion
is fully utilized. With the Company’s current emphasis on maintaining ample liquidity and enhancing balance sheet
strength, share repurchase activity has been suspended. However, extension of this program will provide flexibility to
resume repurchase activity when business conditions permit. In February 2009, 3M’s Board of Directors authorized a
dividend increase of 2 percent for 2009, marking the 51st consecutive year of dividend increases for 3M. 3M’s debt to
total capital ratio (total capital defined as debt plus equity) at December 31, 2008 was 40 percent, compared to 30
percent at December 31, 2007. A portion of the increase in debt was the result of a strategy to build and maintain a
cash buffer in the U.S. in the current market environment. 3M has an AA credit rating from Standard & Poor’s, with a
stable outlook, and an Aa1 credit rating from Moody’s Investors Service, with a negative outlook. The Company has
sufficient access to capital markets to meet currently anticipated growth and acquisition investment funding needs.
In 2008, the Company experienced cost increases affecting metals, wood pulp and oil-derived raw materials. To date
the Company is receiving sufficient quantities of all raw materials to meet its reasonably foreseeable production
requirements. It is impossible to predict future shortages of raw materials or the impact any such shortages would
have. 3M has avoided disruption to its manufacturing operations through careful management of existing raw
material inventories and development and qualification of additional supply sources. 3M manages commodity price
risks through negotiated supply contracts, price protection agreements and forward physical contracts.
In 2009, 3M is changing its annual stock option and restricted stock unit grant date to more closely align the award
with the timing of the Company’s performance review process. In 2009 and forward, under the annual grant, 3M will
grant shares in February instead of May as in previous years. Accounting rules requires recognition of expense
under a non-substantive vesting period approach, requiring compensation expense recognition when an employee is
eligible to retire. 3M employees in the United States are eligible to retire at age 55 and after having completed five
years of service. Approximately 25 percent of the stock-based compensation award expense dollars are for this
retiree-eligible population. Therefore, in 2006, 2007 and 2008 the second quarter of each year (because of the
May grant date) reflected higher stock-based compensation expense than the other quarters. In 2009, the retiree-
eligible impact will shift to the first quarter of 2009. In addition, both the first and second quarter of 2009 will reflect
accelerated stock-based compensation expense related to the earlier February grant date. These and other factors
result in a first quarter 2009 estimate of $0.08 per diluted share for stock-based compensation expense compared to
$0.04 in the first quarter of 2008. In the second quarter of 2009 estimated stock-based compensation is estimated at
$0.04 per diluted share compared to $0.06 in the second quarter of 2008. Refer to Note 16 for additional discussion
of the Company’s stock-based compensation programs.