3M 2008 Annual Report Download - page 16
Download and view the complete annual report
Please find page 16 of the 2008 3M annual report below. You can navigate through the pages in the report by either clicking on the pages listed below, or by using the keyword search tool below to find specific information within the annual report.-
 1
1 -
2
-
3
-
4
-
5
-
 6
6 -
 7
7 -
 8
8 -
 9
9 -
 10
10 -
 11
11 -
 12
12 -
 13
13 -
 14
14 -
 15
15 -
 16
16 -
 17
17 -
 18
18 -
 19
19 -
 20
20 -
 21
21 -
 22
22 -
 23
23 -
 24
24 -
 25
25 -
 26
26 -
27
-
28
-
29
-
30
-
31
-
32
-
33
-
34
-
35
-
36
-
37
-
38
-
39
-
40
-
41
-
42
-
43
-
44
-
45
-
46
-
47
-
48
-
49
-
50
-
51
-
52
-
53
-
54
-
55
-
56
-
57
-
58
-
59
-
60
-
61
-
62
-
63
-
64
-
65
-
66
-
67
-
68
-
69
-
70
-
71
-
72
-
73
-
74
-
75
-
76
-
77
-
78
-
79
-
80
-
81
-
82
-
83
-
84
-
85
-
86
-
87
-
88
-
89
-
90
-
91
-
92
-
93
-
94
-
95
-
96
-
97
-
98
-
99
-
100
-
101
-
102
-
103
-
104
-
105
-
106
-
107
-
108
-
109
-
110
-
111
-
112
 |
 |

10
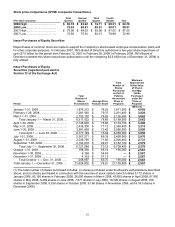
Stock price comparisons (NYSE composite transactions)
(Per share amounts)
First
Quarter
Second
Quarter
Third
Quarter
Fourth
Quarter Year
2008 High .................................... $ 84.76 $ 83.22 $ 74.71 $ 68.31 $ 84.76
2008 Low ..................................... 72.05 68.61 65.51 50.01 50.01
2007 High ..................................... $ 79.88 $ 89.03 $ 93.98 $ 97.00 $ 97.00
2007 Low...................................... 72.90 75.91 83.21 78.98 72.90
Issuer Purchases of Equity Securities
Repurchases of common stock are made to support the Company’s stock-based employee compensation plans and
for other corporate purposes. In February 2007, 3M’s Board of Directors authorized a two-year share repurchase of
up to $7.0 billion for the period from February 12, 2007 to February 28, 2009. In February 2009, 3M’s Board of
Directors extended this share repurchase authorization until the remaining $2.6 billion (as of December 31, 2008) is
fully utilized.
Issuer Purchases of Equity
Securities (registered pursuant to
Section 12 of the Exchange Act)
Period
Total
Number of
Shares
Purchased(1)
Average Price
Paid per Share
Total
Number of
Shares
Purchased
as Part of
Publicly
Announced
Plans or
Programs
Maximum
Approximate
Dollar Value
of Shares
that May
Yet Be
Purchased
under the
Plans or
Programs
(Millions)
January 1-31, 2008 .................................... 1,876,312 $ 78.23 1,871,200
$ 4,002
February 1-29, 2008................................... 2,281,560 $ 79.37 2,201,400
$ 3,828
March 1-31, 2008 ....................................... 2,153,150 $ 78.28 2,126,600
$ 3,662
Total January 1 — March 31, 2008..... 6,311,022 $ 78.66 6,199,200
$ 3,662
April 1-30, 2008 .......................................... 2,148,930 $ 78.82 2,103,100
$ 3,496
May 1-31, 2008 .......................................... 2,436,300 $ 77.12 2,368,400
$ 3,313
June 1-30, 2008 ......................................... 3,591,969 $ 73.42 3,586,500
$ 3,050
Total April 1 — June 30, 2008 ............ 8,177,199 $ 75.94 8,058,000
$ 3,050
July 1-31, 2008........................................... 2,507,271 $ 69.33 2,499,900
$ 2,876
August 1-31, 2008...................................... 2,036,795 $ 71.85 2,026,400
$ 2,731
September 1-30, 2008 ............................... 2,183,018 $ 69.41 2,182,100
$ 2,579
Total July 1 — September 30, 2008 ... 6,727,084 $ 70.12 6,708,400
$ 2,579
October 1-31, 2008 .................................... 198,338 $ 66.14 190,000
$ 2,567
November 1-30, 2008................................. 6,196 $ 58.83 — $ 2,567
December 1-31, 2008................................. 4,163 $ 57.13 — $ 2,567
Total October 1 — Dec. 31, 2008 ....... 208,697 $ 65.75 190,000
$ 2,567
Total January 1 — December 31, 2008 ..... 21,424,002 $ 74.81 21,155,600
$ 2,567
(1) The total number of shares purchased includes: (i) shares purchased under the Board’s authorizations described
above, and (ii) shares purchased in connection with the exercise of stock options (which totaled 5,112 shares in
January 2008, 80,160 shares in February 2008, 26,550 shares in March 2008, 45,830 shares in April 2008, 67,900
shares in May 2008, 5,469 shares in June 2008, 7,371 shares in July 2008, 10,395 shares in August 2008, 918
shares in September 2008, 8,338 shares in October 2008, 6,196 shares in November 2008, and 4,163 shares in
December 2008).