Under Armour 2009 Annual Report Download - page 43
Download and view the complete annual report
Please find page 43 of the 2009 Under Armour annual report below. You can navigate through the pages in the report by either clicking on the pages listed below, or by using the keyword search tool below to find specific information within the annual report.-
 1
1 -
2
-
3
-
4
-
5
-
6
-
7
-
8
-
9
-
10
-
11
-
12
-
13
-
14
-
15
-
16
-
17
-
18
-
19
-
20
-
21
-
22
-
23
-
24
-
25
-
26
-
27
-
28
-
29
-
30
-
31
-
32
-
 33
33 -
 34
34 -
 35
35 -
 36
36 -
 37
37 -
 38
38 -
 39
39 -
 40
40 -
 41
41 -
 42
42 -
 43
43 -
 44
44 -
 45
45 -
 46
46 -
 47
47 -
 48
48 -
 49
49 -
 50
50 -
 51
51 -
 52
52 -
 53
53 -
54
-
55
-
56
-
57
-
58
-
59
-
60
-
61
-
62
-
63
-
64
-
65
-
66
-
67
-
68
-
69
-
70
-
71
-
72
-
73
-
74
-
75
-
76
-
77
-
78
-
79
-
80
-
81
-
82
-
83
-
84
-
85
-
86
-
87
-
88
-
89
-
90
-
91
-
92
 |
 |
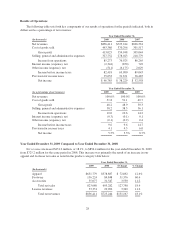
year over year, partially offset by a decrease in net income of $14.3 million. The decrease in net cash outflows
related to changes in operating assets and liabilities period over period was primarily driven by the following:
• a lower investment in inventory of $64.5 million, primarily driven by the operational initiatives put in
place to improve our inventory management; and
• a decrease in accounts receivable during 2008 as compared to an increase in accounts receivable during
2007. This decrease during 2008 was primarily due to improved collection efforts and a lower percentage
growth in net sales during the fourth quarter of 2008 as compared to the same period in the prior year.
During the fourth quarter of 2008, net sales increased by 1.4% as compared to the same period in 2007
versus an increase of 29.0% during the fourth quarter of 2007 as compared to the same period in 2006.
The above noted decreases in net cash outflows related to changes in operating assets were partially offset by a
decrease in accrued expenses and other liabilities of $5.3 million in the year ended December 31, 2008 as compared to
an increase of $11.8 million in the same period of 2007 primarily due to lower accruals for personnel costs in 2008.
Adjustments to net income for non-cash items increased in 2008 as compared to 2007 primarily as a result
of higher depreciation and amortization expense relating to information technology initiatives, branded concept
shops and the improvements to our distribution facilities, unrealized foreign currency exchange rate losses during
2008 as compared to unrealized foreign currency exchange rate gains during 2007, higher stock based
compensation in 2008 and additional reserves for doubtful accounts in 2008.
Investing Activities
Cash used in investing activities decreased $22.2 million to $19.9 million for the year ended December 31,
2009 from $42.1 million for the same period in 2008. This decrease in cash used in investing activities was
primarily due to lower investments in our direct to consumer sales channel, our in-store fixture program and
branded concept shops, our distribution facilities and our information technology initiatives. In addition, cash
used in investing activities decreased due to the lower purchase of trust owned life insurance policies.
Cash used in investing activities increased $8.0 million to $42.1 million for the year ended December 31,
2008 from $34.1 million for the same period in 2007. This increase in cash used in investing activities was
primarily due to additional capital expenditures for our branded concept shops, in-store fixtures and retail stores,
as well as the purchase of trust owned life insurance policies. This increase was partially offset by lower capital
expenditures for our distribution facilities year over year.
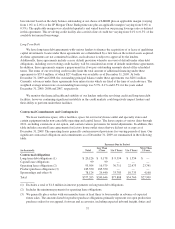
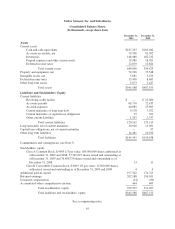
Total capital investments were $24.6 million, $41.1 million and $35.1 million in 2009, 2008 and 2007,
respectively. Total capital investments in 2009, 2008 and 2007 included non-cash transactions of $4.8 million,
$2.5 million and $1.1 million, respectively (refer to non-cash investing activities included on the Consolidated
Statements of Cash Flows). Because we receive certain capital investments prior to transmitting payment for
these capital investments, total capital investments exceed capital expenditures as described above. Capital
expenditures for 2010 are expected to be in the range of $35 million to $40 million, which includes the impact of
shifting some investments from 2009 to 2010.
Financing Activities
Cash used in financing activities increased $51.9 million to $16.5 million for the year ended December 31,
2009 from cash provided by financing activities of $35.4 million for the same period in 2008. This increase was
primarily due to additional net payments made on our revolving credit and long term debt facilities in 2009 as
compared to 2008.
Cash provided by financing activities increased $17.3 million to $35.4 million for the year ended
December 31, 2008 from $18.1 million for the same period in 2007. This increase was primarily due to additional
net proceeds received from our revolving credit and long term debt facilities, partially offset by lower excess tax
benefits from stock-based compensation arrangements.
35