Under Armour 2009 Annual Report Download - page 38
Download and view the complete annual report
Please find page 38 of the 2009 Under Armour annual report below. You can navigate through the pages in the report by either clicking on the pages listed below, or by using the keyword search tool below to find specific information within the annual report.-
 1
1 -
2
-
3
-
4
-
5
-
6
-
7
-
8
-
9
-
10
-
11
-
12
-
13
-
14
-
15
-
16
-
17
-
18
-
19
-
20
-
21
-
22
-
23
-
24
-
25
-
26
-
27
-
 28
28 -
 29
29 -
 30
30 -
 31
31 -
 32
32 -
 33
33 -
 34
34 -
 35
35 -
 36
36 -
 37
37 -
 38
38 -
 39
39 -
 40
40 -
 41
41 -
 42
42 -
 43
43 -
 44
44 -
 45
45 -
 46
46 -
 47
47 -
 48
48 -
49
-
50
-
51
-
52
-
53
-
54
-
55
-
56
-
57
-
58
-
59
-
60
-
61
-
62
-
63
-
64
-
65
-
66
-
67
-
68
-
69
-
70
-
71
-
72
-
73
-
74
-
75
-
76
-
77
-
78
-
79
-
80
-
81
-
82
-
83
-
84
-
85
-
86
-
87
-
88
-
89
-
90
-
91
-
92
 |
 |

• Product innovation and supply chain costs increased $11.6 million to $73.1 million for the year ended
December 31, 2009 from $61.5 million for the same period in 2008 primarily due to higher personnel
costs for the design and sourcing of our expanding apparel and footwear lines, including increased
funding for our performance incentive plan as compared to the prior year. In addition, this increase was
due to higher distribution facilities operating and personnel costs to support our growth. As a
percentage of net revenues, product innovation and supply chain costs remained unchanged at 8.5% for
the years ended December 31, 2009 and 2008.
• Corporate services costs increased $14.4 million to $79.9 million for the year ended December 31,
2009 from $65.5 million for the same period in 2008. This increase was attributable primarily to higher
personnel costs for additional corporate personnel necessary to support our growth, including increased
funding for our performance incentive plan as compared to the prior year. In addition, this increase was
due to higher company-wide stock-based compensation and increased investments in consumer insight
research. These increases were partially offset by decreased allowances for bad debts during 2009. As a
percentage of net revenues, corporate services costs increased to 9.3% for the year ended December 31,
2009 from 9.0% for the same period in 2008 due to the items noted above.
Income from operations increased $8.4 million, or 10.9%, to $85.3 million for the year ended December 31,
2009 from $76.9 million for the same period in 2008. Income from operations as a percentage of net revenues
decreased to 10.0% for the year ended December 31, 2009 from 10.6% for the same period in 2008. This
decrease was a result of a decrease in gross profit as a percentage of net revenues as discussed above.
Interest expense, net increased $1.4 million to $2.3 million for the year ended December 31, 2009 from $0.9
million for the same period in 2008. This increase was primarily due to the write-off of deferred financing costs
related to our prior revolving credit facility and increased costs for our revolving credit facility during 2009.
Other expense, net decreased $5.7 million to $0.5 million for the year ended December 31, 2009 from
$6.2 million for the same period in 2008. This change was primarily due to our expanded foreign currency
exchange hedging strategy in 2009 that reduced our exposure associated with foreign currency exchange rate
fluctuations primarily on intercompany transactions for our European subsidiary in 2009 as compared to the prior
year.
Provision for income taxes increased $3.9 million to $35.6 million during the year ended December 31,
2009 from $31.7 million during the same period in 2008. Our effective tax rate was 43.2% for the year ended
December 31, 2009 compared to 45.3% during the same period in 2008. The effective tax rate for the year ended
December 31, 2009 was lower than the effective tax rate for the same period in 2008 primarily due to decreased
losses in our foreign subsidiaries and certain tax planning strategies implemented during 2009.
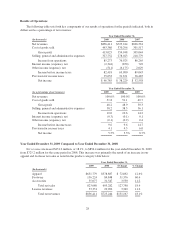
Year Ended December 31, 2008 Compared to Year Ended December 31, 2007
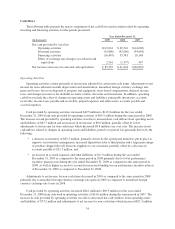
Net revenues increased $118.6 million, or 19.6%, to $725.2 million for the year ended December 31, 2008
from $606.6 million for the same period in 2007. This increase was primarily the result of an increase in our net
sales as noted in the product category table below:
Year Ended December 31,
2008 2007 $ Change % Change
(In thousands)
Apparel $ 578,887 $ 512,613 $ 66,274 12.9%
Footwear 84,848 40,878 43,970 107.6
Accessories 31,547 29,054 2,493 8.6
Total net sales 695,282 582,545 112,737 19.4
License revenues 29,962 24,016 5,946 24.8
Total net revenues $ 725,244 $ 606,561 $ 118,683 19.6%
30