Under Armour 2009 Annual Report Download - page 37
Download and view the complete annual report
Please find page 37 of the 2009 Under Armour annual report below. You can navigate through the pages in the report by either clicking on the pages listed below, or by using the keyword search tool below to find specific information within the annual report.-
 1
1 -
2
-
3
-
4
-
5
-
6
-
7
-
8
-
9
-
10
-
11
-
12
-
13
-
14
-
15
-
16
-
17
-
18
-
19
-
20
-
21
-
22
-
23
-
24
-
25
-
26
-
 27
27 -
 28
28 -
 29
29 -
 30
30 -
 31
31 -
 32
32 -
 33
33 -
 34
34 -
 35
35 -
 36
36 -
 37
37 -
 38
38 -
 39
39 -
 40
40 -
 41
41 -
 42
42 -
 43
43 -
 44
44 -
 45
45 -
 46
46 -
 47
47 -
48
-
49
-
50
-
51
-
52
-
53
-
54
-
55
-
56
-
57
-
58
-
59
-
60
-
61
-
62
-
63
-
64
-
65
-
66
-
67
-
68
-
69
-
70
-
71
-
72
-
73
-
74
-
75
-
76
-
77
-
78
-
79
-
80
-
81
-
82
-
83
-
84
-
85
-
86
-
87
-
88
-
89
-
90
-
91
-
92
 |
 |
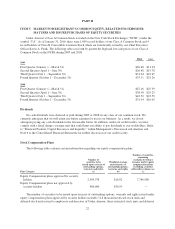
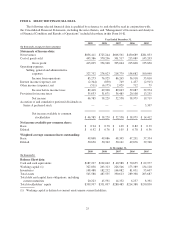
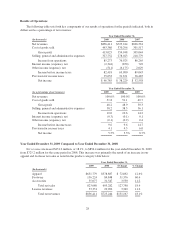
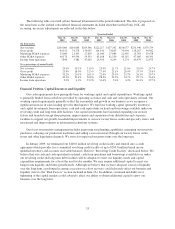
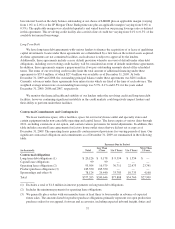
Net sales increased $127.8 million, or 18.4%, to $823.1 million for the year ended December 31, 2009 from
$695.3 million during the same period in 2008 as noted in the table above. The increase in net sales primarily
reflects:
• $51.4 million increase in footwear sales driven primarily by our running footwear launch during the
first quarter of 2009;
• $51.8 million increase in direct to consumer sales growth, including the impact of footwear; and
• apparel unit growth driven by increased distribution and new offerings in multiple product categories,
most significantly in our training, fitness, running and underwear categories.
License revenues increased $3.3 million, or 11.2%, to $33.3 million for the year ended December 31, 2009
from $30.0 million during the same period in 2008. This increase in license revenues was a result of increased
sales by our licensees due to increased distribution and continued unit volume growth, along with new license
agreements for team uniforms and custom-molded mouth guards.
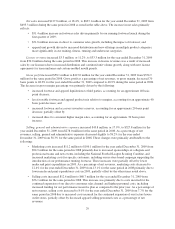
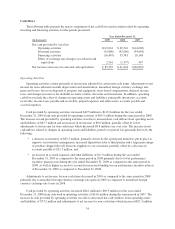
Gross profit increased $58.1 million to $413.0 million for the year ended December 31, 2009 from $354.9
million for the same period in 2008. Gross profit as a percentage of net revenues, or gross margin, decreased 70
basis points to 48.2% for the year ended December 31, 2009 compared to 48.9% during the same period in 2008.
The decrease in gross margin percentage was primarily driven by the following:
• increased footwear and apparel liquidations to third parties, accounting for an approximate 40 basis
point decrease;
• less favorable footwear and apparel product mix relative to margins, accounting for an approximate 40
basis point decrease; and
• increased footwear and accessory inventory reserves, accounting for an approximate 20 basis point
decrease; partially offset by
• increased direct to consumer higher margin sales, accounting for an approximate 30 basis point
increase.
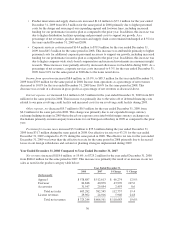
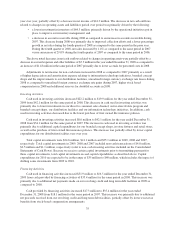
Selling, general and administrative expenses increased $49.8 million, or 17.9%, to $327.8 million for the
year ended December 31, 2009 from $278.0 million for the same period in 2008. As a percentage of net
revenues, selling, general and administrative expenses decreased slightly to 38.2% for the year ended
December 31, 2009 from 38.3% for the same period in 2008. These changes were primarily attributable to the
following:
• Marketing costs increased $11.2 million to $106.1 million for the year ended December 31, 2009 from
$94.9 million for the same period in 2008 primarily due to increased sponsorships of collegiate and
professional teams and new events, including the National Football League Scouting Combine, and
increased marketing costs for specific customers, including our in-store brand campaign supporting the
introduction of our performance running footwear. These increases were partially offset by lower
media and print expenditures in 2009. As a percentage of net revenues, marketing costs decreased to
12.4% for the year ended December 31, 2009 from 13.1% for the same period in 2008 primarily due to
lower media and print expenditures costs in 2009, partially offset by the other items noted above.
• Selling costs increased $12.6 million to $68.7 million for the year ended December 31, 2009 from
$56.1 million for the same period in 2008. This increase was primarily due to costs incurred for the
continued expansion of our direct to consumer sales channel and higher personnel costs, including
increased funding for our performance incentive plan as compared to the prior year. As a percentage of
net revenues, selling costs increased to 8.0% for the year ended December 31, 2009 from 7.7% for the
same period in 2008 due to increased costs incurred for the continued expansion of our factory house
outlet stores, partially offset by decreased apparel selling personnel costs as a percentage of net
revenues.
29