Under Armour 2009 Annual Report Download - page 36
Download and view the complete annual report
Please find page 36 of the 2009 Under Armour annual report below. You can navigate through the pages in the report by either clicking on the pages listed below, or by using the keyword search tool below to find specific information within the annual report.
Results of Operations
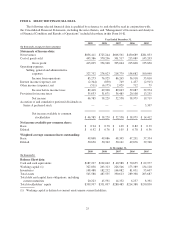
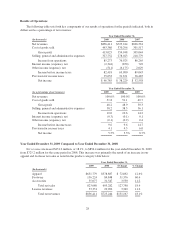
The following table sets forth key components of our results of operations for the periods indicated, both in
dollars and as a percentage of net revenues:
Year Ended December 31,
(In thousands) 2009 2008 2007
Net revenues $856,411 $725,244 $606,561
Cost of goods sold 443,386 370,296 301,517
Gross profit 413,025 354,948 305,044
Selling, general and administrative expenses 327,752 278,023 218,779
Income from operations 85,273 76,925 86,265
Interest income (expense), net (2,344) (850) 749
Other income (expense), net (511) (6,175) 2,029
Income before income taxes 82,418 69,900 89,043
Provision for income taxes 35,633 31,671 36,485
Net income $ 46,785 $ 38,229 $ 52,558
Year Ended December 31,
(As a percentage of net revenues) 2009 2008 2007
Net revenues 100.0% 100.0% 100.0%
Cost of goods sold 51.8 51.1 49.7
Gross profit 48.2 48.9 50.3
Selling, general and administrative expenses 38.2 38.3 36.1
Income from operations 10.0 10.6 14.2
Interest income (expense), net (0.3) (0.1) 0.1
Other income (expense), net (0.1) (0.9) 0.4
Income before income taxes 9.6 9.6 14.7
Provision for income taxes 4.1 4.3 6.0
Net income 5.5% 5.3% 8.7%
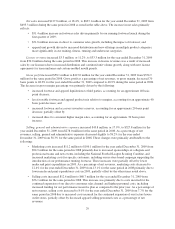
Year Ended December 31, 2009 Compared to Year Ended December 31, 2008
Net revenues increased $131.2 million, or 18.1%, to $856.4 million for the year ended December 31, 2009
from $725.2 million for the same period in 2008. This increase was primarily the result of an increase in our
apparel and footwear net sales as noted in the product category table below:
Year Ended December 31,
2009 2008 $ Change % Change
(In thousands)
Apparel $651,779 $578,887 $ 72,892 12.6%
Footwear 136,224 84,848 51,376 60.6
Accessories 35,077 31,547 3,530 11.2
Total net sales 823,080 695,282 127,798 18.4
License revenues 33,331 29,962 3,369 11.2
Total net revenues $856,411 $725,244 $131,167 18.1%
28


