Under Armour 2009 Annual Report Download - page 40
Download and view the complete annual report
Please find page 40 of the 2009 Under Armour annual report below. You can navigate through the pages in the report by either clicking on the pages listed below, or by using the keyword search tool below to find specific information within the annual report.-
 1
1 -
2
-
3
-
4
-
5
-
6
-
7
-
8
-
9
-
10
-
11
-
12
-
13
-
14
-
15
-
16
-
17
-
18
-
19
-
20
-
21
-
22
-
23
-
24
-
25
-
26
-
27
-
28
-
29
-
 30
30 -
 31
31 -
 32
32 -
 33
33 -
 34
34 -
 35
35 -
 36
36 -
 37
37 -
 38
38 -
 39
39 -
 40
40 -
 41
41 -
 42
42 -
 43
43 -
 44
44 -
 45
45 -
 46
46 -
 47
47 -
 48
48 -
 49
49 -
 50
50 -
51
-
52
-
53
-
54
-
55
-
56
-
57
-
58
-
59
-
60
-
61
-
62
-
63
-
64
-
65
-
66
-
67
-
68
-
69
-
70
-
71
-
72
-
73
-
74
-
75
-
76
-
77
-
78
-
79
-
80
-
81
-
82
-
83
-
84
-
85
-
86
-
87
-
88
-
89
-
90
-
91
-
92
 |
 |
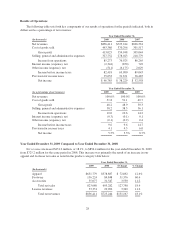
• Product innovation and supply chain costs increased $11.9 million to $61.5 million for the year ended
December 31, 2008 from $49.6 million for the same period in 2007 primarily due to higher distribution
facilities operating and personnel costs to support our growth and higher personnel costs for the design
and sourcing of our expanding footwear and apparel lines. As a percentage of net revenues, product
innovation and supply chain costs increased to 8.5% for the year ended December 31, 2008 from 8.2%
for the same period in 2007 primarily due to the items noted above.
• Corporate services costs increased $10.5 million to $65.5 million for the year ended December 31,
2008 from $55.0 million for the same period in 2007. This increase was attributable primarily to higher
company-wide stock-based compensation, higher allowances for bad debts related to the current
economic conditions and post-implementation consulting costs and depreciation expense related to our
new warehouse management system and other information technology initiatives. As a percentage of
net revenues, corporate services costs decreased slightly to 9.0% for the year ended December 31, 2008
from 9.1% for the same period in 2007.
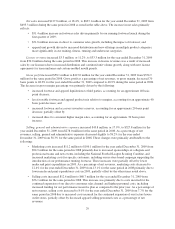
Income from operations decreased $9.4 million, or 10.8%, to $76.9 million for the year ended December 31,
2008 from $86.3 million for the same period in 2007. Income from operations as a percentage of net revenues
decreased to 10.6% for the year ended December 31, 2008 from 14.2% for the same period in 2007. This
decrease was a result of an increase in selling, general and administrative expenses and a decrease in gross profit
as a percentage of net revenues as discussed above.
Interest income (expense), net decreased $1.6 million to ($0.9) million for the year ended December 31,
2008 from $0.7 million for the same period in 2007. This decrease was primarily due to lower interest income
earned on cash and cash equivalents as our investments were lower yielding in 2008 than in 2007 and higher
interest expense due to increased borrowings on our revolving credit and long term debt facilities during 2008 as
compared to 2007.
Other income (expense), net decreased $8.2 million to ($6.2) million for the year ended December 31, 2008
from $2.0 million for the same period in 2007. This change was primarily due to losses on foreign currency
exchange rate changes on transactions primarily denominated in the Euro, partially offset by gains on derivative
financial instruments.
Provision for income taxes decreased $4.8 million to $31.7 million for the year ended December 31, 2008
from $36.5 million for the same period in 2007. For the year ended December 31, 2008, our effective tax rate
was 45.3% compared to 41.0% for the same period in 2007. The increase in the 2008 full year effective tax rate
was primarily attributable to losses in foreign subsidiaries, partially caused by foreign currency exchange rate
losses, which resulted in a larger proportion of our consolidated taxable income earned in the United States,
which has higher tax rates than in our foreign jurisdictions. In addition, the 2008 effective tax rate increase was
also driven by an increase in the state income tax rate in Maryland, where our corporate headquarters is located.
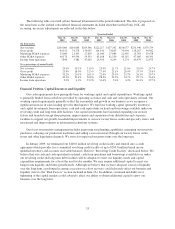
Seasonality
Historically, we have recognized a significant portion of our income from operations in the last two quarters
of the year, driven by increased sales volume of our products during the fall selling season, reflecting our
historical strength in fall sports, and the seasonality of our higher priced COLDGEAR®line. During 2009 and
2008, a larger portion of our income from operations was in the last two quarters of the year partially due to the
shift in the timing of marketing investments to the first two quarters of the year as compared to prior years. The
majority of our net revenues were generated during the last two quarters in each of 2009, 2008 and 2007. The
level of our working capital generally reflects the seasonality and growth in our business. We generally expect
inventory, accounts payable and certain accrued expenses to be higher in the second and third quarters in
preparation for the fall selling season.
32