Under Armour 2009 Annual Report Download - page 42
Download and view the complete annual report
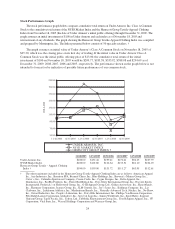
Please find page 42 of the 2009 Under Armour annual report below. You can navigate through the pages in the report by either clicking on the pages listed below, or by using the keyword search tool below to find specific information within the annual report.-
 1
1 -
2
-
3
-
4
-
5
-
6
-
7
-
8
-
9
-
10
-
11
-
12
-
13
-
14
-
15
-
16
-
17
-
18
-
19
-
20
-
21
-
22
-
23
-
24
-
25
-
26
-
27
-
28
-
29
-
30
-
31
-
 32
32 -
 33
33 -
 34
34 -
 35
35 -
 36
36 -
 37
37 -
 38
38 -
 39
39 -
 40
40 -
 41
41 -
 42
42 -
 43
43 -
 44
44 -
 45
45 -
 46
46 -
 47
47 -
 48
48 -
 49
49 -
 50
50 -
 51
51 -
 52
52 -
53
-
54
-
55
-
56
-
57
-
58
-
59
-
60
-
61
-
62
-
63
-
64
-
65
-
66
-
67
-
68
-
69
-
70
-
71
-
72
-
73
-
74
-
75
-
76
-
77
-
78
-
79
-
80
-
81
-
82
-
83
-
84
-
85
-
86
-
87
-
88
-
89
-
90
-
91
-
92
 |
 |

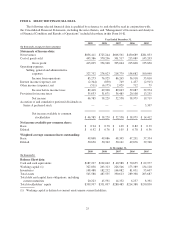
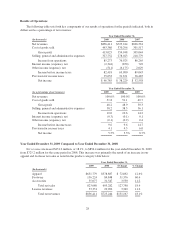
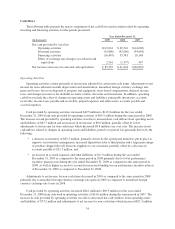
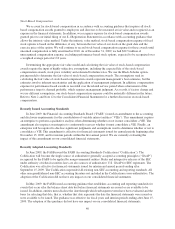
Cash Flows
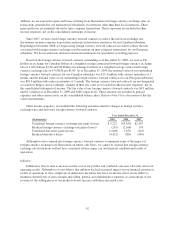
The following table presents the major components of net cash flows used in and provided by operating,
investing and financing activities for the periods presented:
Year Ended December 31,
(In thousands) 2009 2008 2007
Net cash provided by (used in):
Operating activities $119,041 $ 69,516 $(14,628)
Investing activities (19,880) (42,066) (34,084)
Financing activities (16,467) 35,381 18,148
Effect of exchange rate changes on cash and cash
equivalents 2,561 (1,377) 497
Net increase (decrease) in cash and cash equivalents $ 85,255 $ 61,454 $(30,067)
Operating Activities
Operating activities consist primarily of net income adjusted for certain non-cash items. Adjustments to net
income for non-cash items include depreciation and amortization, unrealized foreign currency exchange rate
gains and losses, losses on disposals of property and equipment, stock-based compensation, deferred income
taxes and changes in reserves for doubtful accounts, returns, discounts and inventories. In addition, operating
cash flows include the effect of changes in operating assets and liabilities, principally inventories, accounts
receivable, income taxes payable and receivable, prepaid expenses and other assets, accounts payable and
accrued expenses.
Cash provided by operating activities increased $49.5 million to $119.0 million for the year ended
December 31, 2009 from cash provided by operating activities of $69.5 million during the same period in 2008.
The increase in cash provided by operating activities was due to increased net cash inflows from operating assets
and liabilities of $49.7 million and an increase in net income of $8.6 million, partially offset by lower
adjustments to net income for non-cash items which decreased $8.8 million year over year. The increase in net
cash inflows related to changes in operating assets and liabilities period over period was primarily driven by the
following:
• a decrease in inventory of $52.5 million, primarily driven by the operational initiatives put in place to
improve our inventory management, increased liquidation sales to third parties and a larger percentage
of products shipped directly from our suppliers to our customers, partially offset by a decrease in
accounts payable of $21.3 million; and
• an increase in accrued expenses and other liabilities of $17.0 million during the year ended
December 31, 2009 as compared to the same period in 2008 primarily due to lower performance
incentive plan payouts during the year ended December 31, 2009 as compared to the same period in
2008, as well as higher accruals to account for increased funding for our performance incentive plan as
of December 31, 2009 as compared to December 31, 2008.
Adjustments to net income for non-cash items decreased in 2009 as compared to the same period in 2008
primarily due to unrealized foreign currency exchange rate gains in 2009 as compared to unrealized foreign
currency exchange rate losses in 2008.
Cash provided by operating activities increased $84.1 million to $69.5 million for the year ended
December 31, 2008 from cash used in operating activities of $14.6 million during the same period in 2007. The
increase in cash provided by operating activities was due to decreased net cash outflows from operating assets
and liabilities of $73.2 million and adjustments to net income for non-cash items which increased $25.3 million
34