Under Armour 2009 Annual Report Download - page 41
Download and view the complete annual report
Please find page 41 of the 2009 Under Armour annual report below. You can navigate through the pages in the report by either clicking on the pages listed below, or by using the keyword search tool below to find specific information within the annual report.-
 1
1 -
2
-
3
-
4
-
5
-
6
-
7
-
8
-
9
-
10
-
11
-
12
-
13
-
14
-
15
-
16
-
17
-
18
-
19
-
20
-
21
-
22
-
23
-
24
-
25
-
26
-
27
-
28
-
29
-
30
-
 31
31 -
 32
32 -
 33
33 -
 34
34 -
 35
35 -
 36
36 -
 37
37 -
 38
38 -
 39
39 -
 40
40 -
 41
41 -
 42
42 -
 43
43 -
 44
44 -
 45
45 -
 46
46 -
 47
47 -
 48
48 -
 49
49 -
 50
50 -
 51
51 -
52
-
53
-
54
-
55
-
56
-
57
-
58
-
59
-
60
-
61
-
62
-
63
-
64
-
65
-
66
-
67
-
68
-
69
-
70
-
71
-
72
-
73
-
74
-
75
-
76
-
77
-
78
-
79
-
80
-
81
-
82
-
83
-
84
-
85
-
86
-
87
-
88
-
89
-
90
-
91
-
92
 |
 |

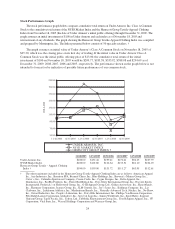
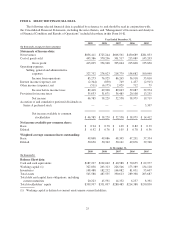
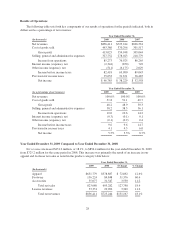
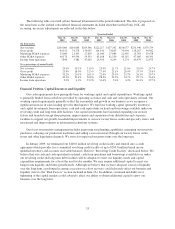
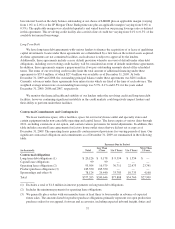
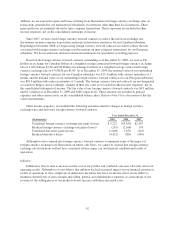
The following table sets forth certain financial information for the periods indicated. The data is prepared on
the same basis as the audited consolidated financial statements included elsewhere in this Form 10-K. All
recurring, necessary adjustments are reflected in the data below.
Quarter Ended
Mar 31,
2009
Jun 30,
2009
Sep 30,
2009
Dec 31,
2009
Mar 31,
2008
Jun 30,
2008
Sep 30,
2008
Dec 31,
2008
(In thousands)
Net revenues $200,000 $164,648 $269,546 $222,217 $157,342 $156,677 $231,946 $179,279
Gross profit 90,551 74,278 134,055 114,141 74,835 70,904 118,267 90,942
Marketing SG&A expenses 33,080 21,303 27,659 24,040 27,986 22,495 24,783 19,678
Other SG&A expenses 49,575 49,594 59,333 63,168 42,550 45,135 47,005 48,391
Income from operations 7,896 3,381 47,063 26,933 4,299 3,274 46,479 22,873
(As a percentage of annual totals)
Net revenues 23.4% 19.2% 31.5% 25.9% 21.7% 21.6% 32.0% 24.7%
Gross profit 21.9% 18.0% 32.5% 27.6% 21.1% 20.0% 33.3% 25.6%
Marketing SG&A expenses 31.2% 20.1% 26.1% 22.6% 29.5% 23.7% 26.1% 20.7%
Other SG&A expenses 22.3% 22.4% 26.8% 28.5% 23.2% 24.7% 25.7% 26.4%
Income from operations 9.2% 4.0% 55.2% 31.6% 5.6% 4.3% 60.4% 29.7%
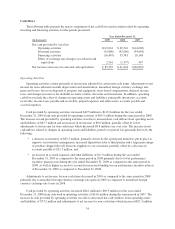
Financial Position, Capital Resources and Liquidity
Our cash requirements have principally been for working capital and capital expenditures. Working capital
is primarily funded from cash flows provided by operating activities and cash and cash equivalents on hand. Our
working capital requirements generally reflect the seasonality and growth in our business as we recognize a
significant increase in sales leading up to the third quarter. We fund our working capital (primarily inventory)
and capital investments from operations, cash and cash equivalents on hand and borrowings available under our
revolving credit and long term debt facilities. Our capital investments have included expanding our in-store
fixture and branded concept shop program, improvements and expansion of our distribution and corporate
facilities to support our growth, leasehold improvements to our new factory house outlet and specialty stores, and
investment and improvements in information technology systems.
Our focus on inventory management includes improving our planning capabilities, managing our inventory
purchases, reducing our production lead times and selling excess inventory through our factory house outlet
stores and other liquidation channels. We strive for improved inventory turns over the long term.
In January 2009, we terminated our $100.0 million revolving credit facility and entered into a credit
agreement which provides for a committed revolving credit facility of up to $200.0 million based on our
qualified inventory and accounts receivable balances. Refer to “Revolving Credit Facility” discussion below. We
believe that our cash and cash equivalents on hand, cash from operations and borrowings available to us under
our revolving credit and long term debt facilities will be adequate to meet our liquidity needs and capital
expenditure requirements for at least the next twelve months. We may require additional capital to meet our
longer term liquidity and future growth needs. Although we believe that we have adequate sources of liquidity
over the long term, a prolonged economic recession or a slow recovery could adversely affect our business and
liquidity (refer to the “Risk Factors” section included in Item 1A). In addition, continued instability in or
tightening of the capital markets could adversely affect our ability to obtain additional capital to grow our
business over the long term.
33