Under Armour 2009 Annual Report Download - page 33
Download and view the complete annual report
Please find page 33 of the 2009 Under Armour annual report below. You can navigate through the pages in the report by either clicking on the pages listed below, or by using the keyword search tool below to find specific information within the annual report.-
 1
1 -
2
-
3
-
4
-
5
-
6
-
7
-
8
-
9
-
10
-
11
-
12
-
13
-
14
-
15
-
16
-
17
-
18
-
19
-
20
-
21
-
22
-
 23
23 -
 24
24 -
 25
25 -
 26
26 -
 27
27 -
 28
28 -
 29
29 -
 30
30 -
 31
31 -
 32
32 -
 33
33 -
 34
34 -
 35
35 -
 36
36 -
 37
37 -
 38
38 -
 39
39 -
 40
40 -
 41
41 -
 42
42 -
 43
43 -
44
-
45
-
46
-
47
-
48
-
49
-
50
-
51
-
52
-
53
-
54
-
55
-
56
-
57
-
58
-
59
-
60
-
61
-
62
-
63
-
64
-
65
-
66
-
67
-
68
-
69
-
70
-
71
-
72
-
73
-
74
-
75
-
76
-
77
-
78
-
79
-
80
-
81
-
82
-
83
-
84
-
85
-
86
-
87
-
88
-
89
-
90
-
91
-
92
 |
 |

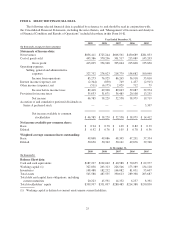
ITEM 6. SELECTED FINANCIAL DATA
The following selected financial data is qualified by reference to, and should be read in conjunction with,
the Consolidated Financial Statements, including the notes thereto, and “Management’s Discussion and Analysis
of Financial Condition and Results of Operations” included elsewhere in this Form 10-K.
Year Ended December 31,
2009 2008 2007 2006 2005
(In thousands, except per share amounts)
Statements of Income data:
Net revenues $856,411 $725,244 $606,561 $430,689 $281,053
Cost of goods sold 443,386 370,296 301,517 215,089 145,203
Gross profit 413,025 354,948 305,044 215,600 135,850
Operating expenses
Selling, general and administrative
expenses 327,752 278,023 218,779 158,682 100,040
Income from operations 85,273 76,925 86,265 56,918 35,810
Interest income (expense), net (2,344) (850) 749 1,457 (2,915)
Other income (expense), net (511) (6,175) 2,029 712 79
Income before income taxes 82,418 69,900 89,043 59,087 32,974
Provision for income taxes 35,633 31,671 36,485 20,108 13,255
Net income 46,785 38,229 52,558 38,979 19,719
Accretion of and cumulative preferred dividends on
Series A preferred stock ————5,307
Net income available to common
stockholders $ 46,785 $ 38,229 $ 52,558 $ 38,979 $ 14,412
Net income available per common share:
Basic $ 0.94 $ 0.78 $ 1.09 $ 0.82 $ 0.39
Diluted $ 0.92 $ 0.76 $ 1.05 $ 0.78 $ 0.36
Weighted average common shares outstanding:
Basic 49,848 49,086 48,345 47,291 37,334
Diluted 50,650 50,342 50,141 49,676 39,768
At December 31,
2009 2008 2007 2006 2005
(In thousands)
Balance Sheet data:
Cash and cash equivalents $187,297 $102,042 $ 40,588 $ 70,655 $ 62,977
Working capital (1) 327,838 263,313 226,546 173,389 134,118
Inventories 148,488 182,232 166,082 81,031 53,607
Total assets 545,588 487,555 390,613 289,368 203,687
Total debt and capital lease obligations, including
current maturities 20,223 45,591 14,332 6,257 8,391
Total stockholders’ equity $399,997 $331,097 $280,485 $214,388 $150,830
(1) Working capital is defined as current assets minus current liabilities.
25