Porsche 2011 Annual Report Download - page 201
Download and view the complete annual report
Please find page 201 of the 2011 Porsche annual report below. You can navigate through the pages in the report by either clicking on the pages listed below, or by using the keyword search tool below to find specific information within the annual report.-
 1
1 -
2
-
3
-
4
-
5
-
6
-
7
-
8
-
9
-
10
-
11
-
12
-
13
-
14
-
15
-
16
-
17
-
18
-
19
-
20
-
21
-
22
-
23
-
24
-
25
-
26
-
27
-
28
-
29
-
30
-
31
-
32
-
33
-
34
-
35
-
36
-
37
-
38
-
39
-
40
-
41
-
42
-
43
-
44
-
45
-
46
-
47
-
48
-
49
-
50
-
51
-
52
-
53
-
54
-
55
-
56
-
57
-
58
-
59
-
60
-
61
-
62
-
63
-
64
-
65
-
66
-
67
-
68
-
69
-
70
-
71
-
72
-
73
-
74
-
75
-
76
-
77
-
78
-
79
-
80
-
81
-
82
-
83
-
84
-
85
-
86
-
87
-
88
-
89
-
90
-
91
-
92
-
93
-
94
-
95
-
96
-
97
-
98
-
99
-
100
-
101
-
102
-
103
-
104
-
105
-
106
-
107
-
108
-
109
-
110
-
111
-
112
-
113
-
114
-
115
-
116
-
117
-
118
-
119
-
120
-
121
-
122
-
123
-
124
-
125
-
126
-
127
-
128
-
129
-
130
-
131
-
132
-
133
-
134
-
135
-
136
-
137
-
138
-
139
-
140
-
141
-
142
-
143
-
144
-
145
-
146
-
147
-
148
-
149
-
150
-
151
-
152
-
153
-
154
-
155
-
156
-
157
-
158
-
159
-
160
-
161
-
162
-
163
-
164
-
165
-
166
-
167
-
168
-
169
-
170
-
171
-
172
-
173
-
174
-
175
-
176
-
177
-
178
-
179
-
180
-
181
-
182
-
183
-
184
-
185
-
186
-
187
-
188
-
189
-
190
-
 191
191 -
 192
192 -
 193
193 -
 194
194 -
 195
195 -
 196
196 -
 197
197 -
 198
198 -
 199
199 -
 200
200 -
 201
201 -
 202
202 -
 203
203 -
 204
204 -
 205
205 -
 206
206 -
 207
207 -
 208
208 -
 209
209 -
 210
210 -
 211
211 -
212
-
213
-
214
-
215
-
216
-
217
-
218
-
219
-
220
-
221
-
222
-
223
-
224
-
225
-
226
-
227
-
228
-
229
-
230
-
231
-
232
-
233
-
234
-
235
-
236
-
237
-
238
-
239
-
240
 |
 |
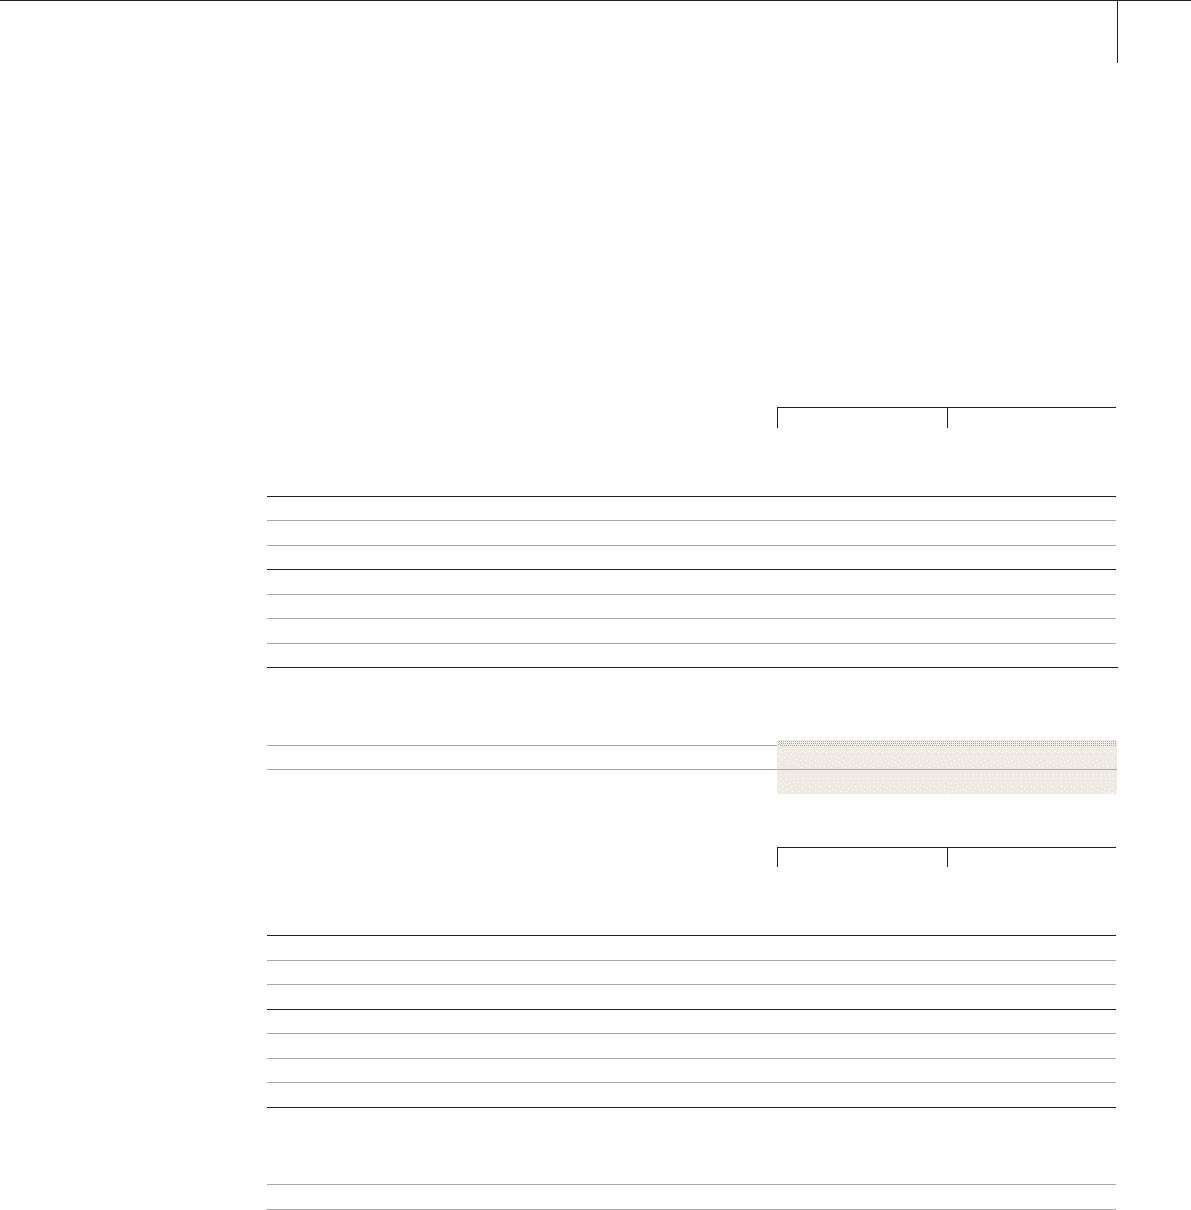
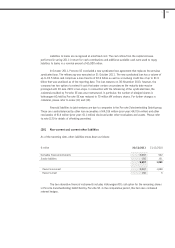
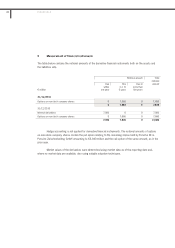
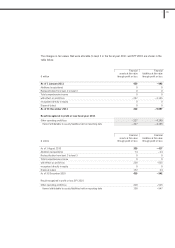
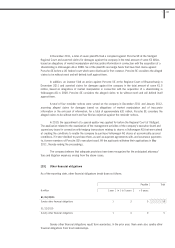
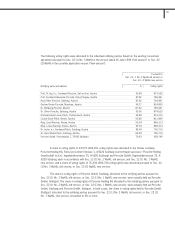
The changes in fair values that were allocable to level 3 in the fiscal year 2011 and SFY 2010 are shown in the
table below.
Financial Financial
€ million
assets at fair value
through profit or loss
liabilities at fair value
through profit or loss
As of 1 January 2011 459 – 942
Additions (acquisitions) 0 0
Reclassification from level 2 to level 3 0 0
Total comprehensive income 0 0
with effect on profit/loss – 227 – 4,145
recognized directly in equity 0 0
Disposal (sales) 0 0
As of 31 December 2011 232 – 5,087
Result recognized in profit or loss fiscal year 2011
Other operating profit/loss – 227 – 4,145
thereof attributable to assets/liabilities held on reporting date – 227 – 4,145
Financial Financial
€ million
assets at fair value
through profit or loss
liabilities at fair value
through profit or loss
As of 1 August 2010 309 – 417
Additions (acquisitions) 74 – 24
Reclassification from level 2 to level 3 0 0
Total comprehensive income 0 0
with effect on profit/loss 228 – 525
recognized directly in equity 0 0
Disposal (sales) 152 24
As of 31 December 2010 459 – 942
Result recognized in profit or loss SFY 2010
Other operating profit/loss 228 – 525
thereof attributable to assets/liabilities held on reporting date 158 – 547
201
3