Porsche 2011 Annual Report Download - page 199
Download and view the complete annual report
Please find page 199 of the 2011 Porsche annual report below. You can navigate through the pages in the report by either clicking on the pages listed below, or by using the keyword search tool below to find specific information within the annual report.-
 1
1 -
2
-
3
-
4
-
5
-
6
-
7
-
8
-
9
-
10
-
11
-
12
-
13
-
14
-
15
-
16
-
17
-
18
-
19
-
20
-
21
-
22
-
23
-
24
-
25
-
26
-
27
-
28
-
29
-
30
-
31
-
32
-
33
-
34
-
35
-
36
-
37
-
38
-
39
-
40
-
41
-
42
-
43
-
44
-
45
-
46
-
47
-
48
-
49
-
50
-
51
-
52
-
53
-
54
-
55
-
56
-
57
-
58
-
59
-
60
-
61
-
62
-
63
-
64
-
65
-
66
-
67
-
68
-
69
-
70
-
71
-
72
-
73
-
74
-
75
-
76
-
77
-
78
-
79
-
80
-
81
-
82
-
83
-
84
-
85
-
86
-
87
-
88
-
89
-
90
-
91
-
92
-
93
-
94
-
95
-
96
-
97
-
98
-
99
-
100
-
101
-
102
-
103
-
104
-
105
-
106
-
107
-
108
-
109
-
110
-
111
-
112
-
113
-
114
-
115
-
116
-
117
-
118
-
119
-
120
-
121
-
122
-
123
-
124
-
125
-
126
-
127
-
128
-
129
-
130
-
131
-
132
-
133
-
134
-
135
-
136
-
137
-
138
-
139
-
140
-
141
-
142
-
143
-
144
-
145
-
146
-
147
-
148
-
149
-
150
-
151
-
152
-
153
-
154
-
155
-
156
-
157
-
158
-
159
-
160
-
161
-
162
-
163
-
164
-
165
-
166
-
167
-
168
-
169
-
170
-
171
-
172
-
173
-
174
-
175
-
176
-
177
-
178
-
179
-
180
-
181
-
182
-
183
-
184
-
185
-
186
-
187
-
188
-
 189
189 -
 190
190 -
 191
191 -
 192
192 -
 193
193 -
 194
194 -
 195
195 -
 196
196 -
 197
197 -
 198
198 -
 199
199 -
 200
200 -
 201
201 -
 202
202 -
 203
203 -
 204
204 -
 205
205 -
 206
206 -
 207
207 -
 208
208 -
 209
209 -
210
-
211
-
212
-
213
-
214
-
215
-
216
-
217
-
218
-
219
-
220
-
221
-
222
-
223
-
224
-
225
-
226
-
227
-
228
-
229
-
230
-
231
-
232
-
233
-
234
-
235
-
236
-
237
-
238
-
239
-
240
 |
 |
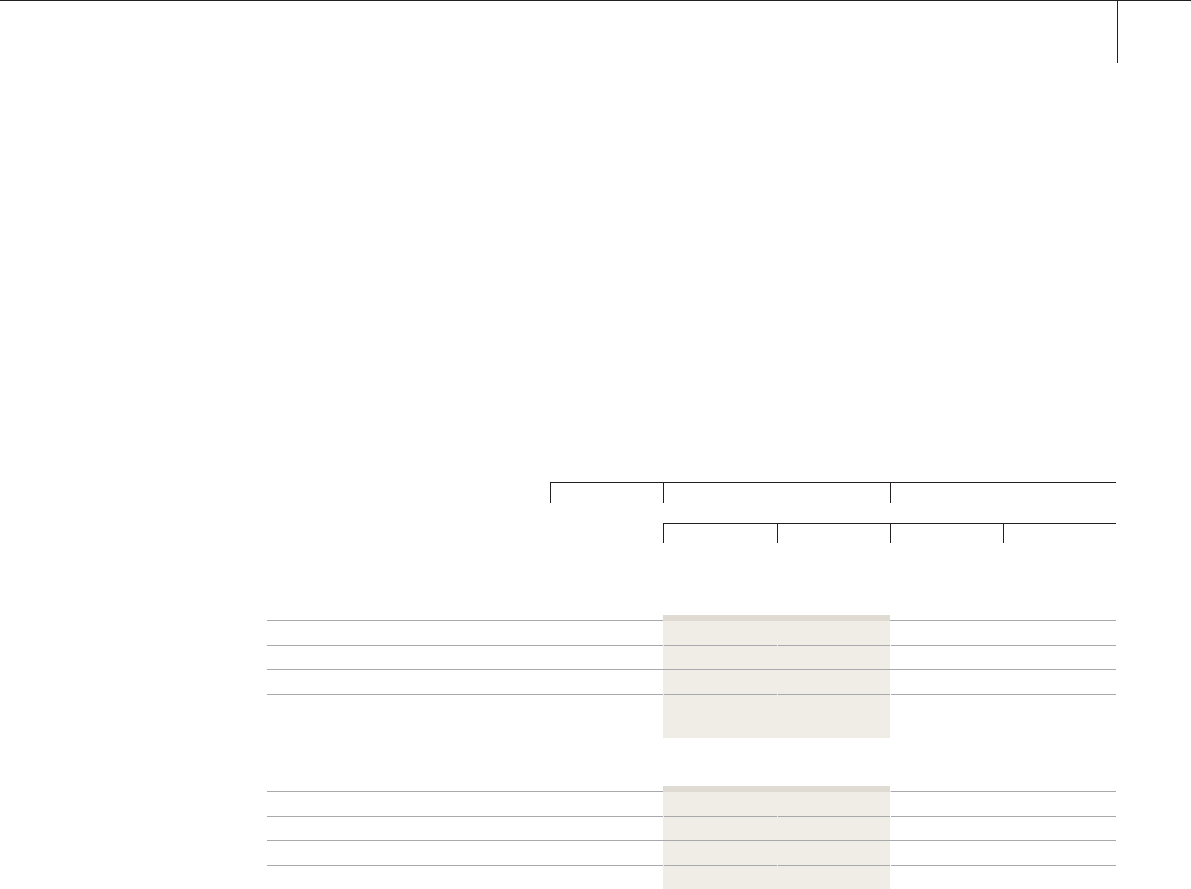
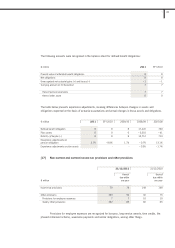
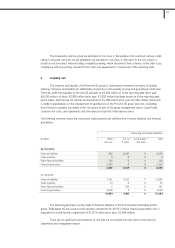
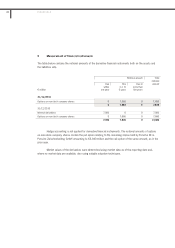
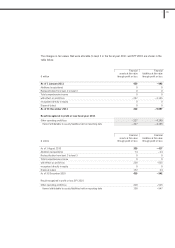
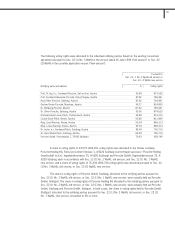
The market value of financial instruments is determined by reference to stock market listings, reference prices
or generally accepted valuation techniques such as the discounted cash flow method. The underlying interest
and discount rates were determined based on the EURIBOR. The following table shows the reconciliation of the
items of the balance sheet to the classes of financial instruments, as well as the comparison of carrying
amount and fair value:
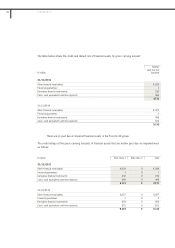
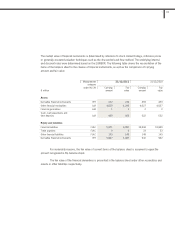
For materiality reasons, the fair value of current items of the balance sheet is assumed to equal the
amount recognized in the balance sheet.
The fair value of the financial derivatives is presented in the balance sheet under other receivables and
assets or other liabilities respectively.
Measurement 31/12/2011 31/12/2010
category
under IAS 39 Carrying Fair Carrying Fair
€ million amount value amount value
Assets
Derivative financial instruments HfT 232 232 459 459
Other financial receivables LaR 4,029 4,249 4,027 4,027
Financial guarantees LaR 1 1 2 2
Cash, cash equivalents and
time deposits LaR 469 469 622 622
Equity and liabilities
Financial liabilities FLAC 5,871 6,097 10,844 10,880
Trade payables FLAC 9 9 33 33
Other financial liabilities FLAC 149 149 149 149
Derivative financial instruments HfT 5,087 5,087 942 942
199
3