Porsche 2011 Annual Report Download - page 137
Download and view the complete annual report
Please find page 137 of the 2011 Porsche annual report below. You can navigate through the pages in the report by either clicking on the pages listed below, or by using the keyword search tool below to find specific information within the annual report.-
 1
1 -
2
-
3
-
4
-
5
-
6
-
7
-
8
-
9
-
10
-
11
-
12
-
13
-
14
-
15
-
16
-
17
-
18
-
19
-
20
-
21
-
22
-
23
-
24
-
25
-
26
-
27
-
28
-
29
-
30
-
31
-
32
-
33
-
34
-
35
-
36
-
37
-
38
-
39
-
40
-
41
-
42
-
43
-
44
-
45
-
46
-
47
-
48
-
49
-
50
-
51
-
52
-
53
-
54
-
55
-
56
-
57
-
58
-
59
-
60
-
61
-
62
-
63
-
64
-
65
-
66
-
67
-
68
-
69
-
70
-
71
-
72
-
73
-
74
-
75
-
76
-
77
-
78
-
79
-
80
-
81
-
82
-
83
-
84
-
85
-
86
-
87
-
88
-
89
-
90
-
91
-
92
-
93
-
94
-
95
-
96
-
97
-
98
-
99
-
100
-
101
-
102
-
103
-
104
-
105
-
106
-
107
-
108
-
109
-
110
-
111
-
112
-
113
-
114
-
115
-
116
-
117
-
118
-
119
-
120
-
121
-
122
-
123
-
124
-
125
-
126
-
 127
127 -
 128
128 -
 129
129 -
 130
130 -
 131
131 -
 132
132 -
 133
133 -
 134
134 -
 135
135 -
 136
136 -
 137
137 -
 138
138 -
 139
139 -
 140
140 -
 141
141 -
 142
142 -
 143
143 -
 144
144 -
 145
145 -
 146
146 -
 147
147 -
148
-
149
-
150
-
151
-
152
-
153
-
154
-
155
-
156
-
157
-
158
-
159
-
160
-
161
-
162
-
163
-
164
-
165
-
166
-
167
-
168
-
169
-
170
-
171
-
172
-
173
-
174
-
175
-
176
-
177
-
178
-
179
-
180
-
181
-
182
-
183
-
184
-
185
-
186
-
187
-
188
-
189
-
190
-
191
-
192
-
193
-
194
-
195
-
196
-
197
-
198
-
199
-
200
-
201
-
202
-
203
-
204
-
205
-
206
-
207
-
208
-
209
-
210
-
211
-
212
-
213
-
214
-
215
-
216
-
217
-
218
-
219
-
220
-
221
-
222
-
223
-
224
-
225
-
226
-
227
-
228
-
229
-
230
-
231
-
232
-
233
-
234
-
235
-
236
-
237
-
238
-
239
-
240
 |
 |

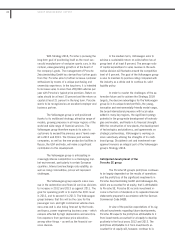
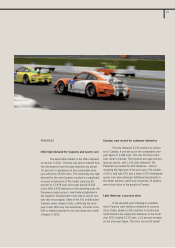
Asia-Pacific: a burgeoning economic area
The importance of the Asia-Pacific region
continues to grow significantly. 3,930 vehicles were
delivered to customers in the fiscal year 2011. This
corresponds to growth of 74 percent. The Cayenne
model series was particularly successful, with 2,300
deliveries. The diesel and hybrid variants generated
particular customer interest. With 990 vehicles deliv-
ered, the Panamera also further consolidated its
position in the market. In the reporting period, Por-
sche was represented by 21 dealers in 13 countries
in the Asia-Pacific region.
Volkswagen group deliveries worldwide
The Volkswagen group delivered 8,265,012
vehicles to customers worldwide in 2011, 1,061,828
or 14.7 percent more than in the prior year. Delivery
figures were higher in all twelve months of the report-
ing period than in the same months of the prior year.
Deliveries of passenger cars and light commercial
vehicles as well as deliveries of trucks and buses are
discussed separately in the following.
Passenger car and light commercial vehicle
deliveries worldwide
With its brands, the Volkswagen group has a
presence in all key automotive markets around the
world. Western Europe, China, Brazil, the USA, Russia,
Argentina and Mexico are currently the key sales
markets for the group. The group continued to extend
its strong competitive position in 2011 thanks to its
attractive and environmentally friendly model offering.
We have increased our market share in key core
markets and again recorded an encouraging global
increase in demand.
The Volkswagen group delivered 8,160,154
passenger cars and light commercial vehicles to
customers across the world in the reporting period,
beating the prior year’s record amount by 14.3 per-
cent. With the exception of Bugatti, all group brands
increased their prior-year sales figures. In particular,
the Volkswagen passenger cars, Audi, ŠKODA, Bent-
ley, Lamborghini and Volkswagen commercial vehicles
brands recorded impressive growth rates for the
period. In the fiscal year 2011, demand for Volks-
wagen group models was higher than in the prior-year
period in virtually all markets. The following sections
explain demand trends for group models in the indi-
vidual markets.
Deliveries in Europe/Remaining markets
In the fiscal year 2011, deliveries to custom-
ers in western Europe were up on the prior year’s
level, in spite of the slight decline in passenger car
markets in several countries. Passenger cars and
light commercial vehicles sold in western Europe
accounted for 38.4 percent (prior year: 40.3 percent)
of the group’s delivery volume. All volume brands
increased sales in the reporting period as against the
prior year. The Touran, Passat saloon, Passat estate,
ŠKODA Fabia estate, ŠKODA Yeti, ŠKODA Octavia
estate and Caddy generated the highest growth rates.
Demand for the new Jetta, Sharan, Audi A1, Audi A7
Sportback, SEAT Ibiza ST and SEAT Alhambra models
was also very encouraging. The Volkswagen group’s
share of the total passenger car market in western
Europe increased from 21.0 percent to 23.0 percent.
In central and eastern Europe, the Volkswagen group
delivered 547,582 units, up 29.4 percent year-on-year.
Sales in Russia and Ukraine recorded the highest
increases. Volkswagen sold 74.4 percent more vehi-
cles in the reporting period (228,977 units) than in
the prior year in the Russian passenger car market. In
central and eastern Europe, almost all models from
Volkswagen passenger cars, the A6 and A8 from
Audi, all ŠKODA models, the SEAT Altea, Multivan/
Transporter and the Caddy saw higher demand than in
the prior year. The new Sharan, Polo notchback, Audi
A1, Audi A7 Sportback, SEAT Ibiza ST, SEAT Alham-
bra and Amarok models were also highly popular.
In South Africa, the Volkswagen group bene-
fited from the boom in the automotive sector, increas-
ing its sales figures by 39.4 percent to 99,407 units.
The entry-level models were particularly sought-after.
The market share held by the group in South Africa
increased to 22.7 percent (prior year: 19.9 percent).
137
2