Porsche 2011 Annual Report Download - page 179
Download and view the complete annual report
Please find page 179 of the 2011 Porsche annual report below. You can navigate through the pages in the report by either clicking on the pages listed below, or by using the keyword search tool below to find specific information within the annual report.-
 1
1 -
2
-
3
-
4
-
5
-
6
-
7
-
8
-
9
-
10
-
11
-
12
-
13
-
14
-
15
-
16
-
17
-
18
-
19
-
20
-
21
-
22
-
23
-
24
-
25
-
26
-
27
-
28
-
29
-
30
-
31
-
32
-
33
-
34
-
35
-
36
-
37
-
38
-
39
-
40
-
41
-
42
-
43
-
44
-
45
-
46
-
47
-
48
-
49
-
50
-
51
-
52
-
53
-
54
-
55
-
56
-
57
-
58
-
59
-
60
-
61
-
62
-
63
-
64
-
65
-
66
-
67
-
68
-
69
-
70
-
71
-
72
-
73
-
74
-
75
-
76
-
77
-
78
-
79
-
80
-
81
-
82
-
83
-
84
-
85
-
86
-
87
-
88
-
89
-
90
-
91
-
92
-
93
-
94
-
95
-
96
-
97
-
98
-
99
-
100
-
101
-
102
-
103
-
104
-
105
-
106
-
107
-
108
-
109
-
110
-
111
-
112
-
113
-
114
-
115
-
116
-
117
-
118
-
119
-
120
-
121
-
122
-
123
-
124
-
125
-
126
-
127
-
128
-
129
-
130
-
131
-
132
-
133
-
134
-
135
-
136
-
137
-
138
-
139
-
140
-
141
-
142
-
143
-
144
-
145
-
146
-
147
-
148
-
149
-
150
-
151
-
152
-
153
-
154
-
155
-
156
-
157
-
158
-
159
-
160
-
161
-
162
-
163
-
164
-
165
-
166
-
167
-
168
-
 169
169 -
 170
170 -
 171
171 -
 172
172 -
 173
173 -
 174
174 -
 175
175 -
 176
176 -
 177
177 -
 178
178 -
 179
179 -
 180
180 -
 181
181 -
 182
182 -
 183
183 -
 184
184 -
 185
185 -
 186
186 -
 187
187 -
 188
188 -
 189
189 -
190
-
191
-
192
-
193
-
194
-
195
-
196
-
197
-
198
-
199
-
200
-
201
-
202
-
203
-
204
-
205
-
206
-
207
-
208
-
209
-
210
-
211
-
212
-
213
-
214
-
215
-
216
-
217
-
218
-
219
-
220
-
221
-
222
-
223
-
224
-
225
-
226
-
227
-
228
-
229
-
230
-
231
-
232
-
233
-
234
-
235
-
236
-
237
-
238
-
239
-
240
 |
 |

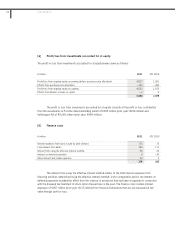
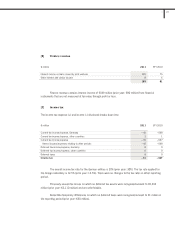
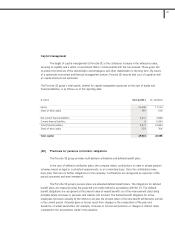
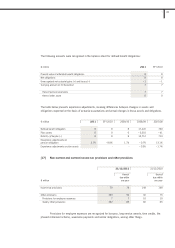
[8] Profit/loss attributable to non-controlling interests
The profit/loss attributable to non-controlling interests, which is allocable to the investors in hybrid
capital, amounts to €22 million (prior year: €11 million).
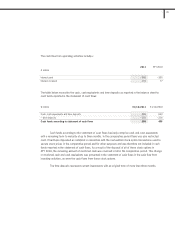
[9] Earnings per share
Earnings per share are calculated by dividing the profit or loss attributable to the shareholders of
Porsche SE by the total number of shares outstanding in the fiscal year. The additional dividend of 0.6 cents
per share to which the preference shares are entitled was deducted when calculating earnings per share for
ordinary shares. This gave rise to the difference in earnings per share between ordinary and preference shares.
The new ordinary and preference shares with retroactive profit participation as of 1 August 2010 that
were issued within the scope of the capital increase performed in April 2011 were included pro rata in the
calculation of the earnings per share. As the subscription price of these new ordinary and preference shares
was below their fair value on the date of issue of the subscription rights, it was necessary to adjust the
average number of shares for the reporting period and the comparative period.
There were no dilutive effects.
2011 SFY 2010
Profit/loss for the year € million 59 1,286
Profit/loss attributable to non-controlling interests –
hybrid capital investors € million 22 11
Profit/loss attributable to shareholders of Porsche SE € million 37 1,275
Profit/loss attributable to ordinary shares (basic) € million 17.7 636.9
Profit/loss attributable to preference shares (basic) € million 19.3 638.1
Profit/loss attributable to ordinary shares (diluted) € million 17.7 636.9
Profit/loss attributable to preference shares (diluted) € million 19.3 638.1
Average number of ordinary shares outstanding Number 137,524,543 96,901,572
Average number of preference shares outstanding Number 137,524,543 96,901,572
Earnings per ordinary share (basic) € 0.13 6.57
Earnings per preference share (basic) € 0.14 6.58
Earnings per ordinary share (diluted) € 0.13 6.57
Earnings per preference share (diluted) € 0.14 6.58
179
3