Porsche 2011 Annual Report Download - page 200
Download and view the complete annual report
Please find page 200 of the 2011 Porsche annual report below. You can navigate through the pages in the report by either clicking on the pages listed below, or by using the keyword search tool below to find specific information within the annual report.-
 1
1 -
2
-
3
-
4
-
5
-
6
-
7
-
8
-
9
-
10
-
11
-
12
-
13
-
14
-
15
-
16
-
17
-
18
-
19
-
20
-
21
-
22
-
23
-
24
-
25
-
26
-
27
-
28
-
29
-
30
-
31
-
32
-
33
-
34
-
35
-
36
-
37
-
38
-
39
-
40
-
41
-
42
-
43
-
44
-
45
-
46
-
47
-
48
-
49
-
50
-
51
-
52
-
53
-
54
-
55
-
56
-
57
-
58
-
59
-
60
-
61
-
62
-
63
-
64
-
65
-
66
-
67
-
68
-
69
-
70
-
71
-
72
-
73
-
74
-
75
-
76
-
77
-
78
-
79
-
80
-
81
-
82
-
83
-
84
-
85
-
86
-
87
-
88
-
89
-
90
-
91
-
92
-
93
-
94
-
95
-
96
-
97
-
98
-
99
-
100
-
101
-
102
-
103
-
104
-
105
-
106
-
107
-
108
-
109
-
110
-
111
-
112
-
113
-
114
-
115
-
116
-
117
-
118
-
119
-
120
-
121
-
122
-
123
-
124
-
125
-
126
-
127
-
128
-
129
-
130
-
131
-
132
-
133
-
134
-
135
-
136
-
137
-
138
-
139
-
140
-
141
-
142
-
143
-
144
-
145
-
146
-
147
-
148
-
149
-
150
-
151
-
152
-
153
-
154
-
155
-
156
-
157
-
158
-
159
-
160
-
161
-
162
-
163
-
164
-
165
-
166
-
167
-
168
-
169
-
170
-
171
-
172
-
173
-
174
-
175
-
176
-
177
-
178
-
179
-
180
-
181
-
182
-
183
-
184
-
185
-
186
-
187
-
188
-
189
-
 190
190 -
 191
191 -
 192
192 -
 193
193 -
 194
194 -
 195
195 -
 196
196 -
 197
197 -
 198
198 -
 199
199 -
 200
200 -
 201
201 -
 202
202 -
 203
203 -
 204
204 -
 205
205 -
 206
206 -
 207
207 -
 208
208 -
 209
209 -
 210
210 -
211
-
212
-
213
-
214
-
215
-
216
-
217
-
218
-
219
-
220
-
221
-
222
-
223
-
224
-
225
-
226
-
227
-
228
-
229
-
230
-
231
-
232
-
233
-
234
-
235
-
236
-
237
-
238
-
239
-
240
 |
 |
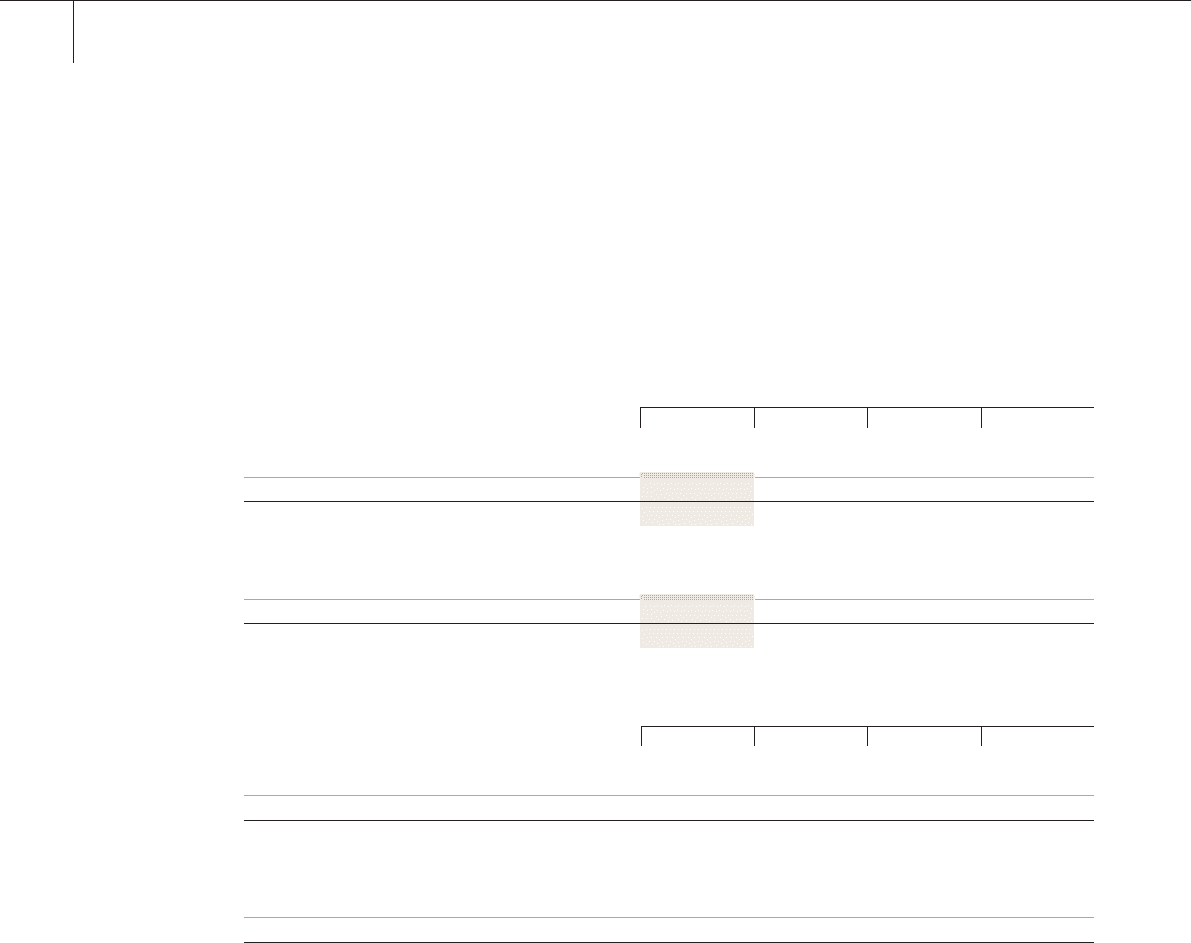
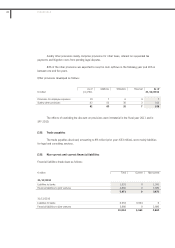
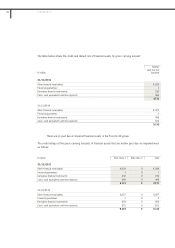
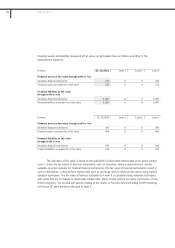
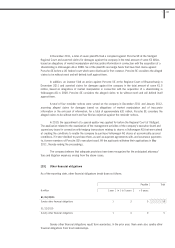
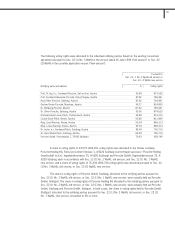
Financial assets and liabilities measured at fair value can be broken down as follows according to the
measurement hierarchy:
The allocation of fair value is based on the availability of observable market data on an active market.
Level 1 shows the fair values of financial instruments, such as securities, where a quoted price is directly
available on active markets for identical financial instruments. The fair value of financial instruments in level 2,
such as derivatives, is derived from market data such as exchange rates or interest rate curves using market
valuation techniques. The fair value of financial instruments in level 3 is calculated using valuation techniques
with inputs that are not based on observable market data. These include options for equity instruments of non-
listed companies. The put and call options relating to the shares in Porsche Zwischenholding GmbH remaining
at Porsche SE were therefore allocated to level 3.
€ million 31/12/2011 Level 1 Level 2 Level 3
Financial assets at fair value through profit or loss
Derivative financial instruments 232 0 0 232
Financial assets accounted for at fair value 232 0 0 232
Financial liabilities at fair value
through profit or loss
Derivative financial instruments 5,087 0 0 5,087
Financial liabilities accounted for at fair value 5,087 0 0 5,087
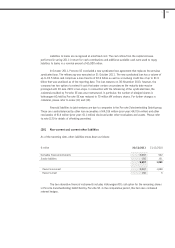
€ million 31/12/2010 Level 1 Level 2 Level 3
Financial assets at fair value through profit or loss
Derivative financial instruments 459 0 0 459
Financial assets accounted for at fair value 459 0 0 459
Financial liabilities at fair value
through profit or loss
Derivative financial instruments 942 0 0 942
Financial liabilities accounted for at fair value 942 0 0 942
200 FINANCIALS