Office Depot 2007 Annual Report Download - page 26
Download and view the complete annual report
Please find page 26 of the 2007 Office Depot annual report below. You can navigate through the pages in the report by either clicking on the pages listed below, or by using the keyword search tool below to find specific information within the annual report.-
 1
1 -
2
-
3
-
4
-
5
-
6
-
7
-
8
-
9
-
10
-
11
-
12
-
13
-
14
-
15
-
 16
16 -
 17
17 -
 18
18 -
 19
19 -
 20
20 -
 21
21 -
 22
22 -
 23
23 -
 24
24 -
 25
25 -
 26
26 -
 27
27 -
 28
28 -
 29
29 -
 30
30 -
 31
31 -
 32
32 -
 33
33 -
 34
34 -
 35
35 -
 36
36 -
37
-
38
-
39
-
40
-
41
-
42
-
43
-
44
-
45
-
46
-
47
-
48
-
49
-
50
-
51
-
52
-
53
-
54
-
55
-
56
-
57
-
58
-
59
-
60
-
61
-
62
-
63
-
64
-
65
-
66
-
67
-
68
-
69
-
70
-
71
-
72
-
73
-
74
-
75
-
76
-
77
-
78
-
79
-
80
-
81
-
82
-
83
-
84
-
85
-
86
-
87
-
88
 |
 |

24
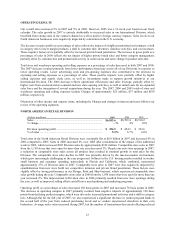
traffic as economic conditions slowed. Operating margin was further impacted by approximately 60 basis points
from a de-leveraging of fixed property costs and 30 basis points from higher supply chain costs. Additionally, we
experienced higher levels of inventory shrink, which had a negative impact on operating margin of approximately 30
basis points. Partially offsetting these factors, we expanded our selection of private brands which had a positive
impact on operating margins in 2007. Private brand penetration also positively impacted operating margins in 2006.
Our operating expenses as a percentage of sales were lower in 2007 and 2006 compared to the prior year. The 2007
decrease totaled approximately 90 basis points and reflects a reduction in advertising costs as well as lower
performance-based variable pay commensurate with lower Division performance and lower pre-opening expenses
related to a reduction in new store openings. The 2006 decrease was attributable primarily to lower store operating
costs, partially offset by increased advertising and pre-opening expenses. The store expansion and remodel program
has impacted our operating expenses by additional pre-opening expenses related to new stores, as well as
accelerating depreciation for stores being remodeled and incurring non-capitalizable remodeling costs. We exclude
the brief remodel period from our comp sales calculation to partially account for the disruption.
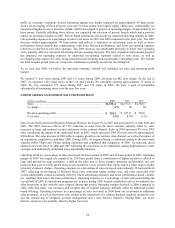
As we look into 2008, we believe the uncertain economic outlook will challenge our sales and operating profit
margin.
We opened 71 new stores during 2007 and 115 stores during 2006, all using our M2 store design. At the end of
2007, we operated 1,222 retail stores in the U.S. and Canada. We anticipate opening approximately 75 stores in
2008. We also remodeled 177 stores during 2007 and 176 stores in 2006. We have a goal of remodeling
substantially all remaining stores over the next few years.
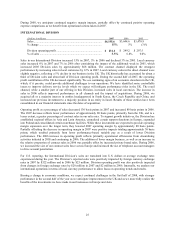
NORTH AMERICAN BUSINESS SOLUTIONS DIVISION
(Dollars in millions) 2007 2006 2005
Sales ............................................................................................... $4,518.4 $4,576.8 $4,300.8
% change ........................................................................................ -1% 6% 6%
Division operating profit ................................................................ $ 220.1 $ 367.0 $ 350.8
% of sales ....................................................................................... 4.9% 8.0% 8.2%
Sales in our North American Business Solutions Division decreased 1% in 2007 and increased 6% in both 2006 and
2005. The 2007 decrease reflects an 11% reduction in sales from the direct channel, partially offset by sales
increases in large and national account customers in the contract channel. Sales in 2006 increased 9% over 2005
after considering the impact of the additional week in 2005, which increased 2005 Division sales by approximately
$90 million. The sales increase in 2006 reflects organic growth in our contract sales channel, as well as the impact of
an acquisition completed in mid-May 2006. During 2005, we began offering a combined catalog to the previously
separate Office Depot and Viking catalog customers and completed that integration in 2006. As expected, direct
channel sales were lower in 2006 and 2007 following the conversion as we eliminated catalog duplications to create
synergies and deliberately eliminated some unprofitable business.
Operating profit as a percentage of sales decreased 310 basis points in 2007 and 20 basis points in 2006. Operating
margin in 2007 was negatively impacted by 280 basis points from a combination of higher incentives offered to
large and national account customers, a shift in the sales mix to lower margin customers and products, net cost
increases that were not fully passed along to our customers, lower vendor rebate funds, and to a lesser degree, higher
inventory clearance charges. Operating expenses as a percentage of sales increased approximately 30 basis points in
2007, reflecting de-leveraging of Division fixed costs, somewhat higher selling costs, and costs associated with
certain unprofitable contracts partially offset by lower advertising expenses and lower performance-based variable
pay resulting from lower Division performance. Operating expenses as a percentage of sales decreased during the
second half of 2007 as operational programs put in place during 2006 became established and as we adjusted our
sales headcount in line with the sales softness during that period. Operating margin declined in 2006 compared to
2005, reflecting paper cost increases and a higher mix of contract business, partially offset by additional private
brand offerings. Operating expenses as a percentage of sales increased in 2006 from our investment in additional
sales personnel, as well as short-term costs related to the integration of a contract business acquired during the year
and the outsourcing of telephone account management and a new delivery initiative. During 2006, our lower
delivery expenses were partially offset by higher fuel costs.