Office Depot 2007 Annual Report Download - page 25
Download and view the complete annual report
Please find page 25 of the 2007 Office Depot annual report below. You can navigate through the pages in the report by either clicking on the pages listed below, or by using the keyword search tool below to find specific information within the annual report.-
 1
1 -
2
-
3
-
4
-
5
-
6
-
7
-
8
-
9
-
10
-
11
-
12
-
13
-
14
-
 15
15 -
 16
16 -
 17
17 -
 18
18 -
 19
19 -
 20
20 -
 21
21 -
 22
22 -
 23
23 -
 24
24 -
 25
25 -
 26
26 -
 27
27 -
 28
28 -
 29
29 -
 30
30 -
 31
31 -
 32
32 -
 33
33 -
 34
34 -
 35
35 -
36
-
37
-
38
-
39
-
40
-
41
-
42
-
43
-
44
-
45
-
46
-
47
-
48
-
49
-
50
-
51
-
52
-
53
-
54
-
55
-
56
-
57
-
58
-
59
-
60
-
61
-
62
-
63
-
64
-
65
-
66
-
67
-
68
-
69
-
70
-
71
-
72
-
73
-
74
-
75
-
76
-
77
-
78
-
79
-
80
-
81
-
82
-
83
-
84
-
85
-
86
-
87
-
88
 |
 |

23
OPERATING RESULTS
Our overall sales increased 3% in 2007 and 5% in 2006. However, 2005 was a 53-week year based on our fiscal
calendar. The sales growth in 2007 is entirely attributable to increased sales in our International Division, which
benefited from strong sales in the contract channel as well as positive foreign currency impacts. Sales levels in our
North American businesses were negatively impacted by a downturn in the U.S. economy.
The decrease in gross profit as a percentage of sales reflects the impact of a highly promotional environment, a shift
in category mix to lower margin products, a shift in customer mix, inventory clearance activities, and cost increases.
These negative factors were partially offset by increased private brand penetration. The increase in gross profit as a
percentage of sales in 2006 reflects the net impact of higher private brand sales and better category management,
partially offset by customer mix and promotional activity in certain areas and some change in product sales mix.
Total store and warehouse operating and selling expenses as a percentage of sales decreased in both 2007 and 2006.
The 2007 decrease resulted primarily from lower performance-based pay across all of our Divisions in response to
lower operating results. Lower advertising costs and pre-opening expenses also contributed to the decrease in
operating and selling expenses as a percentage of sales. These positive impacts were partially offset by higher
selling expenses and supply chain costs, as well as investments made to support growth initiatives in our
International Division. The 2006 decrease reflects operational efficiencies and sales leverage, partially offset by
higher costs from accelerated store remodel and new store opening activities, as well as initial costs for an expanded
sales force and the integration of several acquisitions during the year. The 2007, 2006 and 2005 totals of store and
warehouse operating and selling expenses include Charges of approximately $25 million, $37 million and $109
million, respectively.
Discussion of other income and expense items, including the Charges and changes in interest and taxes follows our
review of the operating segments.
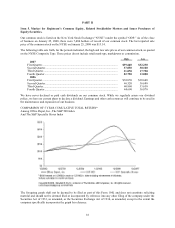
NORTH AMERICAN RETAIL DIVISION
(Dollars in millions) 2007 2006 2005
Sales ............................................................................................... $6,813.6 $6,789.4 $6,510.2
% change ........................................................................................ —% 4% 10%
Division operating profit ................................................................ $ 354.5 $ 454.3 $ 393.6
% of sales ....................................................................................... 5.2% 6.7% 6.0%
Total sales in the North American Retail Division were essentially flat at $6.8 billion in 2007 and increased 4% in
2006 compared to 2005. Sales in 2006 increased 6% over 2005 after consideration of the impact of the additional
week in 2005, which increased 2005 Division sales by approximately $122 million. Comparable store sales in 2007
from the 1,158 stores that were open for more than one year decreased 5%. Despite our new store openings in 2007,
a reduction in comparable store sales across all product lines resulted in minimal growth in total sales for this
Division. The comparable store sales decline in 2007 was primarily driven by the macroeconomic environment,
which grew increasingly challenging as the year progressed. Softness in the U.S. housing market resulted in weaker
small business and consumer spending, particularly in Florida and California, which combined, represented
approximately 27% of Division sales in 2007. Comparable store sales in 2007 were also negatively impacted by
cannibalization from new store build out, competitive intrusion and private brand penetration. These factors were
slightly offset by strong performance in our Design, Print and Ship business, which experienced comparable store
sales growth during the year. Comparable store sales in 2006 from the 1,036 stores that were open for more than one
year increased 2%. The improvement in Division sales in 2006 primarily resulted from new store openings during
the year, as well as improved selling efforts and effective merchandising and marketing programs.
Operating profit as a percentage of sales decreased 150 basis points in 2007 and increased 70 basis points in 2006.
The decrease in operating margins in 2007 primarily resulted from negative impacts of approximately 120 basis
points from declining product margins, which were driven by increased promotional activities and a shift in category
mix. Although flat for the full year of 2007, we also experienced a significant decrease in vendor program funds in
the second half of the year from reduced purchasing levels and as vendors experienced slowdown in their own
businesses. Average order value increased during 2007, but the number of transactions decreased reflecting reduced