Office Depot 2007 Annual Report Download - page 22
Download and view the complete annual report
Please find page 22 of the 2007 Office Depot annual report below. You can navigate through the pages in the report by either clicking on the pages listed below, or by using the keyword search tool below to find specific information within the annual report.-
 1
1 -
2
-
3
-
4
-
5
-
6
-
7
-
8
-
9
-
10
-
11
-
 12
12 -
 13
13 -
 14
14 -
 15
15 -
 16
16 -
 17
17 -
 18
18 -
 19
19 -
 20
20 -
 21
21 -
 22
22 -
 23
23 -
 24
24 -
 25
25 -
 26
26 -
 27
27 -
 28
28 -
 29
29 -
 30
30 -
 31
31 -
 32
32 -
33
-
34
-
35
-
36
-
37
-
38
-
39
-
40
-
41
-
42
-
43
-
44
-
45
-
46
-
47
-
48
-
49
-
50
-
51
-
52
-
53
-
54
-
55
-
56
-
57
-
58
-
59
-
60
-
61
-
62
-
63
-
64
-
65
-
66
-
67
-
68
-
69
-
70
-
71
-
72
-
73
-
74
-
75
-
76
-
77
-
78
-
79
-
80
-
81
-
82
-
83
-
84
-
85
-
86
-
87
-
88
 |
 |

20
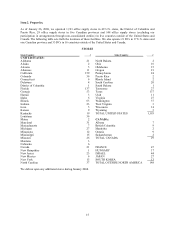
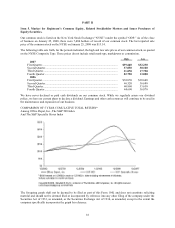
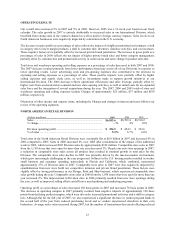
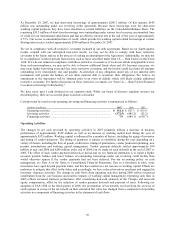
Item 6. Selected Financial Data.
The following table sets forth selected consolidated financial data at and for each of the five fiscal years in the
period ended December 29, 2007. It should be read in conjunction with the Consolidated Financial Statements and
Notes thereto, included in Item 8 of this report, and Management’s Discussion and Analysis of Financial Condition
and Results of Operations, included in Item 7 of this report.
(In thousands, except per share amounts and statistical data) 2007 2006(1) 2005(2) 2004 2003(3)(4)
Statements of Earnings Data:
Sales............................................................................................................... $ 15,527,537 $ 15,010,781 $ 14,278,944 $ 13,564,699 $ 12,358,566
Earnings from continuing operations before cumulative effect of
accounting change ....................................................................................... $ 395,615 $ 503,471 $ 273,792 $ 335,504 $ 299,244
Net earnings................................................................................................... $ 395,615 $ 503,471 $ 273,792 $ 335,504 $ 273,515
Earnings per share from continuing operations before cumulative effect of
accounting change:......................................................................................
Basic................................................................................................... $ 1.45 $ 1.79 $ 0.88 $ 1.08 $ 0.97
Diluted................................................................................................ 1.43 1.75 0.87 1.06 0.95
Net earnings per share:
Basic ................................................................................................... $ 1.45 $ 1.79 $ 0.88 $ 1.08 $ 0.88
Diluted................................................................................................ 1.43 1.75 0.87 1.06 0.87
Statistical Data:
Facilities open at end of period:
United States and Canada:
Office supply stores............................................................................ 1,222 1,158 1,047 969 900
Distribution centers ............................................................................ 21 20 20 22 22
Call centers ........................................................................................ — — 3 13 13
International (5):
Office supply stores............................................................................ 148 125 70 78 64
Distribution centers ............................................................................ 33 32 25 25 25
Call centers ........................................................................................ 31 30 31 31 31
Total square footage — North American Retail Division ............................ 29,790,082 28,520,269 26,261,318 24,791,255 23,620,343
Percentage of sales by segment:
North American Retail Division.............................................................. 43.9% 45.2% 45.6% 43.8% 45.7%
North American Business Solutions Division......................................... 29.1% 30.5% 30.1% 29.8% 32.1%
International Division .............................................................................. 27.0% 24.3% 24.3% 26.4% 22.2%
Balance Sheet Data:
Total assets .................................................................................................... $ 7,256,540 $ 6,557,438 $ 6,098,525 $ 6,794,338 $ 6,194,679
Long-term debt, excluding current maturities............................................... 607,462 570,752 569,098 583,680 829,302
____________
(1) Statements of Earnings Data for fiscal year 2006 and Balance Sheet Data for 2006, have been restated to reflect
adjustments for vendor program accounting, which were filed on Form 10-K/A on November 20, 2007.
(2) Includes 53 weeks in accordance with our 52-53 week reporting convention.
(3) Statements of Earnings Data and Balance Sheet Data for fiscal year 2003 have been restated to reflect
adjustments for lease accounting.
(4) Reflects the acquisition of Guilbert in June. Also, net earnings and net earnings per share data reflect cumulative
effect of adopting a new accounting pronouncement.
(5) Facilities of wholly-owned or majority-owned entities operated by our International Division.