Memorex 2012 Annual Report Download - page 93
Download and view the complete annual report
Please find page 93 of the 2012 Memorex annual report below. You can navigate through the pages in the report by either clicking on the pages listed below, or by using the keyword search tool below to find specific information within the annual report.-
 1
1 -
2
-
3
-
4
-
5
-
6
-
7
-
8
-
9
-
10
-
11
-
12
-
13
-
14
-
15
-
16
-
17
-
18
-
19
-
20
-
21
-
22
-
23
-
24
-
25
-
26
-
27
-
28
-
29
-
30
-
31
-
32
-
33
-
34
-
35
-
36
-
37
-
38
-
39
-
40
-
41
-
42
-
43
-
44
-
45
-
46
-
47
-
48
-
49
-
50
-
51
-
52
-
53
-
54
-
55
-
56
-
57
-
58
-
59
-
60
-
61
-
62
-
63
-
64
-
65
-
66
-
67
-
68
-
69
-
70
-
71
-
72
-
73
-
74
-
75
-
76
-
77
-
78
-
79
-
80
-
81
-
82
-
 83
83 -
 84
84 -
 85
85 -
 86
86 -
 87
87 -
 88
88 -
 89
89 -
 90
90 -
 91
91 -
 92
92 -
 93
93 -
 94
94 -
 95
95 -
 96
96 -
 97
97 -
 98
98 -
 99
99 -
 100
100 -
 101
101 -
 102
102 -
 103
103 -
104
-
105
-
106
-
107
-
108
-
109
-
110
-
111
-
112
-
113
-
114
-
115
-
116
 |
 |

NOTES TO CONSOLIDATED FINANCIAL STATEMENTS — (Continued)
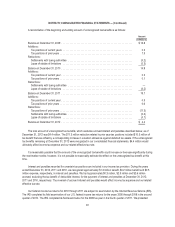
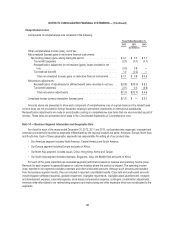
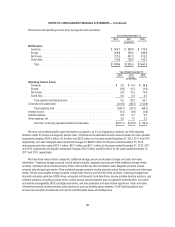
Net revenue by major product category was as follows:
Years Ended December 31,
2012 2011 2010
(In Millions)
Net Revenue
Traditional storage .........................................
Optical products ........................................ $ 426.8 $ 511.9 $ 619.3
Magnetic products ....................................... 286.2 327.4 347.8
Other traditional storage .................................. 15.4 47.7 62.8
Total traditional storage ................................. 728.4 887.0 1,029.9
Secure and scalable storage ................................. 210.1 210.1 207.5
Audio and video information .................................. 161.1 193.3 223.5
Total ................................................. $1,099.6 $1,290.4 $1,460.9
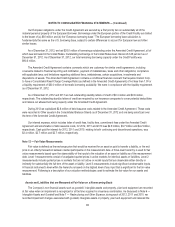
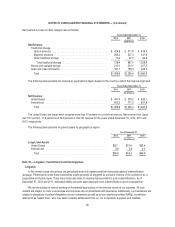
The following table presents net revenue by geographical region based on the country in which the revenue originated:
Years Ended December 31,
2012 2011 2010
(In millions)
Net Revenue
United States ............................................. $ 447.4 $ 519.2 $ 633.1
International ............................................. 652.2 771.2 827.8
Total ................................................. $1,099.6 $1,290.4 $1,460.9
The United States and Japan each comprise more than 10 percent of our total net revenue. Net revenue from Japan
was 19.7 percent, 17.6 percent and 16.0 percent of total net revenue for the years ended December 31, 2012, 2011 and
2010, respectively.
The following table presents long-lived assets by geographical region:
As of December 31,
2012 2011 2010
(In millions)
Long-Lived Assets
United States ............................................. $55.1 $51.6 $62.4
International ............................................. 3.8 3.8 4.5
Total ................................................. $58.9 $55.4 $66.9
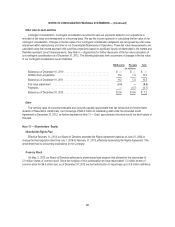
Note 15 — Litigation, Commitments and Contingencies
Litigation
In the normal course of business, we periodically enter into agreements that incorporate general indemnification
language. Performance under these indemnities would generally be triggered by a breach of terms of the contract or by a
supportable third-party claim. There have historically been no material losses related to such indemnifications. As of
December 31, 2012 and 2011, estimated liability amounts associated with such indemnifications are inconsequential.
We are the subject of various pending or threatened legal actions in the ordinary course of our business. All such
matters are subject to many uncertainties and outcomes are not predictable with assurance. Additionally, our businesses are
subject to allegations of patent infringement by our competitors as well as by non-practicing entities (NPEs), sometimes
referred to as “patent trolls,” who may seek monetary settlements from us, our competitors, suppliers and resellers.
90