Memorex 2012 Annual Report Download - page 74
Download and view the complete annual report
Please find page 74 of the 2012 Memorex annual report below. You can navigate through the pages in the report by either clicking on the pages listed below, or by using the keyword search tool below to find specific information within the annual report.-
 1
1 -
2
-
3
-
4
-
5
-
6
-
7
-
8
-
9
-
10
-
11
-
12
-
13
-
14
-
15
-
16
-
17
-
18
-
19
-
20
-
21
-
22
-
23
-
24
-
25
-
26
-
27
-
28
-
29
-
30
-
31
-
32
-
33
-
34
-
35
-
36
-
37
-
38
-
39
-
40
-
41
-
42
-
43
-
44
-
45
-
46
-
47
-
48
-
49
-
50
-
51
-
52
-
53
-
54
-
55
-
56
-
57
-
58
-
59
-
60
-
61
-
62
-
63
-
 64
64 -
 65
65 -
 66
66 -
 67
67 -
 68
68 -
 69
69 -
 70
70 -
 71
71 -
 72
72 -
 73
73 -
 74
74 -
 75
75 -
 76
76 -
 77
77 -
 78
78 -
 79
79 -
 80
80 -
 81
81 -
 82
82 -
 83
83 -
 84
84 -
85
-
86
-
87
-
88
-
89
-
90
-
91
-
92
-
93
-
94
-
95
-
96
-
97
-
98
-
99
-
100
-
101
-
102
-
103
-
104
-
105
-
106
-
107
-
108
-
109
-
110
-
111
-
112
-
113
-
114
-
115
-
116
 |
 |

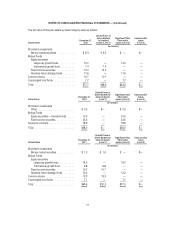
NOTES TO CONSOLIDATED FINANCIAL STATEMENTS — (Continued)
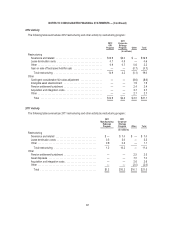
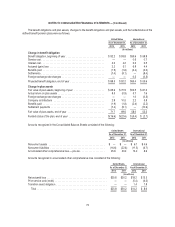
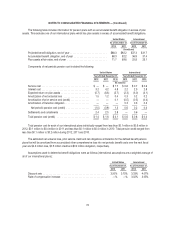
Total stock-based compensation expense associated with stock options recognized in the Consolidated Statements of
Operations for the years ended December 31, 2012, 2011 and 2010 was $3.6 million, $4.1 million and $3.8 million,
respectively. This expense would result in related tax benefits of $1.1 million, $1.3 million and $1.2 million for the years ended
December 31, 2012, 2011 and 2010, respectively. However, these tax benefits are included in the U.S. deferred tax assets
which are subject to a full valuation allowance, and due to the valuation allowance, we did not recognize the related tax
benefits in 2012, 2011 and 2010. As of December 31, 2012 there was $5.4 million of total unrecognized compensation
expense related to outstanding stock options. That expense is expected to be recognized over a weighted average period of
1.8 years.
No related stock-based compensation was capitalized as part of an asset for the years ended December 31, 2012, 2011
or 2010.
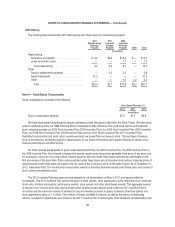
Restricted Stock
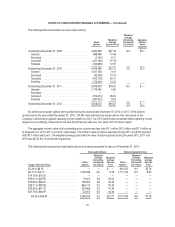
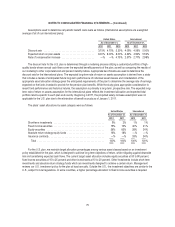
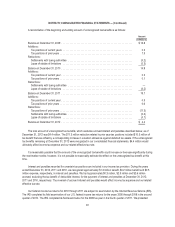
The following table summarizes our restricted stock activity:
Restricted
Stock
Weighted
Average
Grant Date
Fair Value
Per Share
Nonvested as of December 31, 2009 ...................................... 461,702 $14.84
Granted ......................................................... 524,655 10.45
Vested .......................................................... (209,302) 15.17
Forfeited ......................................................... (37,859) 11.15
Nonvested as of December 31, 2010 ...................................... 739,196 $11.34
Granted ......................................................... 385,049 9.28
Vested .......................................................... (274,934) 12.15
Forfeited ......................................................... (54,265) 12.05
Nonvested as of December 31, 2011 ...................................... 795,046 $10.02
Granted ......................................................... 708,573 5.67
Vested .......................................................... (321,103) 10.30
Forfeited ......................................................... (156,712) 8.72
Nonvested as of December 31, 2012 ...................................... 1,025,804 $ 7.12
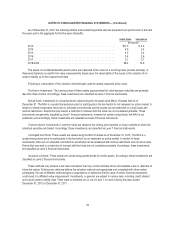
There were no performance-based restricted shares granted during the years ended December 31, 2012 or 2011. Of
the restricted shares granted during the year ended December 31, 2010, 265,837 were performance-based awards that vest
based on the Company’s performance against operating income targets for 2010. Our 2010 performance exceeded these
operating income targets and accordingly, these restricted shares will vest 25 percent per year over four years from the date
of grant.
The total fair value of shares that vested during the years 2012, 2011 and 2010 was $3.3 million, $3.3 million and $3.2
million, respectively.
Total related stock-based compensation expense recognized in the Consolidated Statements of Operations for the years
ended December 31, 2012, 2011 and 2010 was $3.6 million, $3.4 million and $3.1 million, respectively. This expense would
result in related tax benefits of $1.4 million, $1.3 million and $1.2 million for the years ended December 31, 2012, 2011 and
2010, respectively. However, these tax benefits are included in the U.S. deferred tax assets which are subject to a full
valuation allowance and due to the valuation allowance, we did not recognize the related tax benefit in 2012, 2011 and 2010.
As of December 31, 2012 there was $4.8 million of total unrecognized compensation expense related to outstanding restricted
stock. That expense is expected to be recognized over a weighted average period of 1.7 years.
71