Memorex 2012 Annual Report Download - page 77
Download and view the complete annual report
Please find page 77 of the 2012 Memorex annual report below. You can navigate through the pages in the report by either clicking on the pages listed below, or by using the keyword search tool below to find specific information within the annual report.-
 1
1 -
2
-
3
-
4
-
5
-
6
-
7
-
8
-
9
-
10
-
11
-
12
-
13
-
14
-
15
-
16
-
17
-
18
-
19
-
20
-
21
-
22
-
23
-
24
-
25
-
26
-
27
-
28
-
29
-
30
-
31
-
32
-
33
-
34
-
35
-
36
-
37
-
38
-
39
-
40
-
41
-
42
-
43
-
44
-
45
-
46
-
47
-
48
-
49
-
50
-
51
-
52
-
53
-
54
-
55
-
56
-
57
-
58
-
59
-
60
-
61
-
62
-
63
-
64
-
65
-
66
-
 67
67 -
 68
68 -
 69
69 -
 70
70 -
 71
71 -
 72
72 -
 73
73 -
 74
74 -
 75
75 -
 76
76 -
 77
77 -
 78
78 -
 79
79 -
 80
80 -
 81
81 -
 82
82 -
 83
83 -
 84
84 -
 85
85 -
 86
86 -
 87
87 -
88
-
89
-
90
-
91
-
92
-
93
-
94
-
95
-
96
-
97
-
98
-
99
-
100
-
101
-
102
-
103
-
104
-
105
-
106
-
107
-
108
-
109
-
110
-
111
-
112
-
113
-
114
-
115
-
116
 |
 |

NOTES TO CONSOLIDATED FINANCIAL STATEMENTS — (Continued)
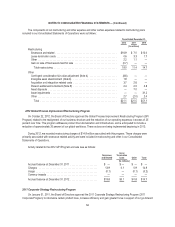
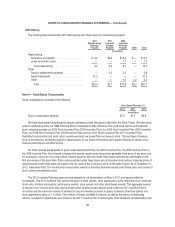
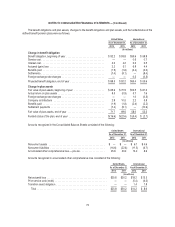
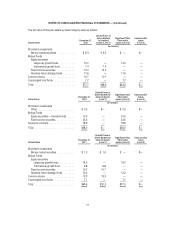
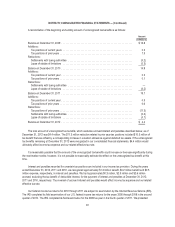
The following table includes information for pension plans with an accumulated benefit obligation in excess of plan
assets. This excludes one of our international plans which has plan assets in excess of accumulated benefit obligations.
United States International
As of December 31, As of December 31,
2012 2011 2012 2011
(In millions)
Projected benefit obligation, end of year ........................... $88.3 $92.2 $37.3 $31.7
Accumulated benefit obligation, end of year ........................ 88.3 92.2 36.9 31.4
Plan assets at fair value, end of year ............................. 71.7 69.6 25.8 25.1
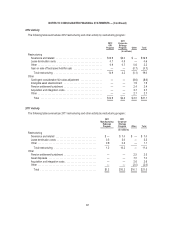
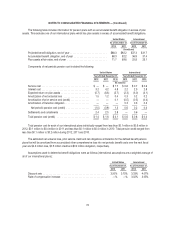
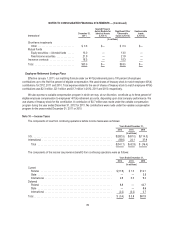
Components of net periodic pension cost included the following:
United States International
Years Ended December 31, Years Ended December 31,
2012 2011 2010 2012 2011 2010
(In millions)
Service cost ................................... $ — $ — $1.7 $0.6 $0.7 $0.6
Interest cost ................................... 3.2 4.2 4.8 2.2 2.5 2.8
Expected return on plan assets ..................... (5.7) (6.3) (5.7) (2.3) (3.0) (3.1)
Amortization of net actuarial loss ................... 1.5 1.2 0.4 0.3 0.2 0.2
Amortization of prior service cost (credit) .............. — — 0.1 (0.5) (0.5) (0.4)
Amortization of transition obligation .................. — — — 0.3 0.3 0.3
Net periodic pension cost (credit) ................. (1.0) (0.9) 1.3 0.6 0.2 0.4
Settlements and curtailments ...................... 2.4 2.5 2.8 — 0.6 —
Total pension cost (credit) ........................ $1.4 $1.6 $4.1 $0.6 $0.8 $0.4
Total pension cost for each of our international plans individually ranged from less than $0.1 million to $0.6 million in
2012, $0.1 million to $0.4 million in 2011 and less than $0.1 million to $0.4 million in 2010. Total pension credit ranged from
less than $0.1 million to $0.2 million during 2012, 2011 and 2010.
The estimated net actuarial loss, prior service credit and net obligations at transition for the defined benefit pension
plans that will be amortized from accumulated other comprehensive loss into net periodic benefit costs over the next fiscal
year are $2.3 million loss, $0.5 million credit and $0.2 million obligation, respectively.
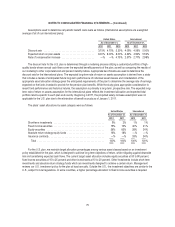
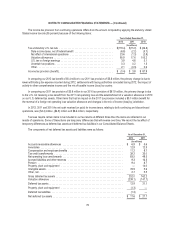
Assumptions used to determine benefit obligations were as follows (international assumptions are a weighted average of
all of our international plans):
United States International
As of December 31, As of December 31,
2012 2011 2012 2011
Discount rate .............................................. 3.50% 3.75% 3.33% 4.07%
Rate of compensation increase ................................ —% —% 3.02% 3.05%
74