Memorex 2012 Annual Report Download - page 32
Download and view the complete annual report
Please find page 32 of the 2012 Memorex annual report below. You can navigate through the pages in the report by either clicking on the pages listed below, or by using the keyword search tool below to find specific information within the annual report.-
 1
1 -
2
-
3
-
4
-
5
-
6
-
7
-
8
-
9
-
10
-
11
-
12
-
13
-
14
-
15
-
16
-
17
-
18
-
19
-
20
-
21
-
 22
22 -
 23
23 -
 24
24 -
 25
25 -
 26
26 -
 27
27 -
 28
28 -
 29
29 -
 30
30 -
 31
31 -
 32
32 -
 33
33 -
 34
34 -
 35
35 -
 36
36 -
 37
37 -
 38
38 -
 39
39 -
 40
40 -
 41
41 -
 42
42 -
43
-
44
-
45
-
46
-
47
-
48
-
49
-
50
-
51
-
52
-
53
-
54
-
55
-
56
-
57
-
58
-
59
-
60
-
61
-
62
-
63
-
64
-
65
-
66
-
67
-
68
-
69
-
70
-
71
-
72
-
73
-
74
-
75
-
76
-
77
-
78
-
79
-
80
-
81
-
82
-
83
-
84
-
85
-
86
-
87
-
88
-
89
-
90
-
91
-
92
-
93
-
94
-
95
-
96
-
97
-
98
-
99
-
100
-
101
-
102
-
103
-
104
-
105
-
106
-
107
-
108
-
109
-
110
-
111
-
112
-
113
-
114
-
115
-
116
 |
 |

continues to meet the criteria for held for sale accounting and, therefore, remains classified in other current assets on the
Consolidated Balance Sheet as of December 31, 2012 at a book value of $0.2 million. On October 7, 2011 we entered into an
agreement to sell the land for $10.5 million, contingent upon the change of certain zoning requirements for the land as well as
other standard conditions. If these conditions are met, the sale is expected to close in 2013.
During 2010 we recorded $0.2 million of other charges related to the 2008 Corporate Program. Additionally during 2010,
other expenses included costs associated with the announced retirement of our former Vice Chairman and Chief Executive
Officer, including a severance related charge of $1.4 million and a charge of $0.8 million related to the accelerated vesting of
his unvested options and restricted stock.
In 2010, certain assets held primarily at our Weatherford, Oklahoma facility were determined to be impaired in
accordance with the provisions of impairment of long-lived assets. These long-lived assets held and used include the
property, building and equipment primarily related to the manufacturing of magnetic tape which was consolidated to the TDK
Group Yamanashi manufacturing facility in 2011 as a part of our 2011 Manufacturing Program. The land and building had a
carrying amount of $17.0 million and were written down to their fair value of $2.3 million, resulting in an impairment charge of
$14.7 million during 2010. The fair value of the equipment was assessed based upon sales proceeds from similar equipment
sold as part of the closing of our Camarillo, California facility. The Weatherford equipment had a carrying amount of $17.4
million and was written down to its fair value of $0.9 million resulting in an impairment charge of $16.5 million during 2010.
The impairments were recorded as part of restructuring and other charges in our Consolidated Statements of Operations in
2010. As of June 30, 2011, our Weatherford facility met the criteria for classification as held for sale outlined in the accounting
guidance for the sale of a long-lived asset. Accordingly, the book values of the building and property of $2.3 million were
transferred into other current assets on our Consolidated Balance Sheets and are no longer being depreciated.
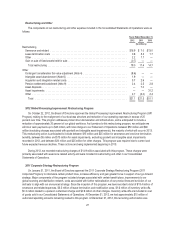
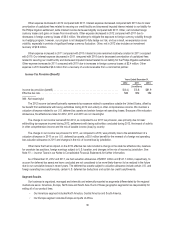
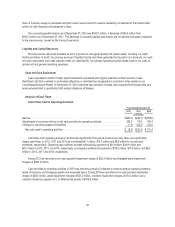
Operating Loss
Years Ended December 31, Percent Change
2012 2011 2010 2012 vs. 2011 2011 vs. 2010
(In millions)
Operating loss ..................................... $(336.1) $(33.1) $(69.7) NM (52.5)%
As a percent of revenue ............................ (30.6)% (2.6)% (4.8)%
NM - Not meaningful
Operating loss increased in 2012 compared with 2011 due primarily to intangible asset impairment losses of $260.5
million and a goodwill impairment charge of $23.3 million.
Operating loss decreased in 2011 compared with 2010 due primarily to lower restructuring and other charges of $29.6
million and lower goodwill impairment charges of $21.9 million, partially offset by lower revenue resulting in lower gross profit
of $9.7 million as well as higher R&D expense of $4.6 million, each as discussed above.
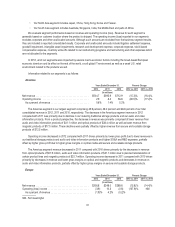
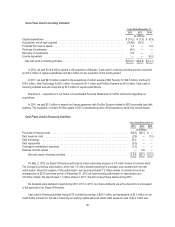
Other (Income) and Expense
Years Ended December 31, Percent Change
2012 2011 2010 2012 vs. 2011 2011 vs. 2010
(In millions)
Interest income .................................... $(0.5) $(0.9) $(0.8) (44.4)% 12.5%
Interest expense ................................... 2.9 3.7 4.2 (21.6)% (11.9)%
Other, net ........................................ 2.6 7.0 3.3 (62.9)% 112.1%
Total ........................................ $5.0 $9.8 $6.7 (49.0)% 46.3%
As a percent of revenue ............................ 0.5% 0.8% 0.5%
29