Memorex 2012 Annual Report Download - page 64
Download and view the complete annual report
Please find page 64 of the 2012 Memorex annual report below. You can navigate through the pages in the report by either clicking on the pages listed below, or by using the keyword search tool below to find specific information within the annual report.-
 1
1 -
2
-
3
-
4
-
5
-
6
-
7
-
8
-
9
-
10
-
11
-
12
-
13
-
14
-
15
-
16
-
17
-
18
-
19
-
20
-
21
-
22
-
23
-
24
-
25
-
26
-
27
-
28
-
29
-
30
-
31
-
32
-
33
-
34
-
35
-
36
-
37
-
38
-
39
-
40
-
41
-
42
-
43
-
44
-
45
-
46
-
47
-
48
-
49
-
50
-
51
-
52
-
53
-
 54
54 -
 55
55 -
 56
56 -
 57
57 -
 58
58 -
 59
59 -
 60
60 -
 61
61 -
 62
62 -
 63
63 -
 64
64 -
 65
65 -
 66
66 -
 67
67 -
 68
68 -
 69
69 -
 70
70 -
 71
71 -
 72
72 -
 73
73 -
 74
74 -
75
-
76
-
77
-
78
-
79
-
80
-
81
-
82
-
83
-
84
-
85
-
86
-
87
-
88
-
89
-
90
-
91
-
92
-
93
-
94
-
95
-
96
-
97
-
98
-
99
-
100
-
101
-
102
-
103
-
104
-
105
-
106
-
107
-
108
-
109
-
110
-
111
-
112
-
113
-
114
-
115
-
116
 |
 |

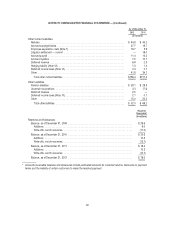
NOTES TO CONSOLIDATED FINANCIAL STATEMENTS — (Continued)
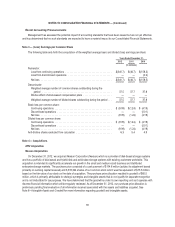
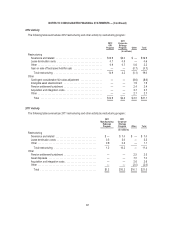
Note 6 — Intangible Assets and Goodwill
Intangible Assets
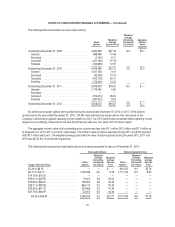
Intangible assets consist of the following:
Trade
Names Software
Customer
Relationships Other Total
(In millions)
December 31, 2012
Cost ................................... $ 37.7 $ 58.4 $ 21.2 $26.8 $ 144.1
Accumulated amortization ................... (6.0) (52.0) (1.0) (3.2) (62.2)
Intangible assets, net .................... $ 31.7 $ 6.4 $ 20.2 $23.6 $ 81.9
December 31, 2011
Cost ................................... $347.1 $ 57.9 $ 61.5 $13.9 $ 480.4
Accumulated amortization ................... (57.5) (51.1) (45.5) (4.6) (158.7)
Intangible assets, net .................... $289.6 $ 6.8 $ 16.0 $ 9.3 $ 321.7
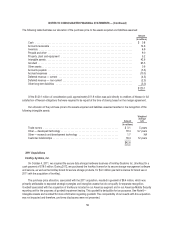
During the fourth quarter of 2012, we determined that the results of our revised internal financial forecast, which was
finalized during the quarter and took into account the expected actions and outcomes associated with the acceleration of our
strategic transformation (as further described in Note 1 — Basis of Presentation.), qualified as a triggering event for
impairment testing. This required the assessment of the recoverability of the long-lived assets (including definite-lived
intangible assets) included in all of our asset groups with the exception of the recent acquisition of Nexsan.
We generally determined our asset groups to be associated with our various brands as that is the lowest level for which
identifiable cash flows are largely independent of one another. Based on the facts that existed in the fourth quarter and as of
December 31, 2012, all of our long-lived assets were evaluated for impairment under the “held and used” impairment model
and, while we were in the process of exploring strategic options (including potential disposition) of our XtremeMac and
Memorex brands (pertaining only to the consumer electronics products), such asset groups did not qualify as being classified
as held-for-sale as of December 31, 2012 as the criteria for such classification were not met as of that date.
We compared the carrying value of our asset groups with their estimated undiscounted future cash flows and
determined that the carrying value of certain asset groups exceeded the undiscounted cash flows expected to be generated
by the asset group. For those asset groups, we then compared the carrying value of the asset group to its estimated fair value
to determine the amount by which our long-lived assets (primarily intangible assets) within the asset group were impaired. As
a result of these analyses, we recorded an impairment charge of $260.5 million in the Consolidated Statements of Operations.
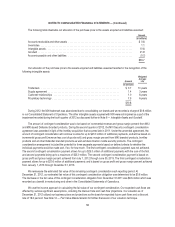
In calculating the estimated fair value of the asset groups, we used the income approach, a valuation technique under
which we estimate future cash flows using our financial forecasts associated with the asset groups. Our expected cash flows
are affected by various significant assumptions, including projected sales, gross margin and expense expectations as well as
a discount rate. Our analyses utilized forecasted cash flows ranging from a four year to a 10 year period depending on the
asset group, and our business plans served as the basis for these cash flow assumptions. The analysis utilized discount rates
ranging from 15.0 percent to 15.5 percent depending on the asset group.
As a part of this analysis, we also re-assessed the useful lives of any remaining intangible assets, excluding the
intangible assets acquired in the recent Nexsan acquisition, and have adjusted the remaining lives accordingly.
Also during 2012, we accelerated the amortization of several intangible assets due to certain business decisions to
abandon the intangible assets during year. The total charge for the accelerated amortization of these intangible assets was
$1.9 million which was recorded in restructuring and other in the Consolidated Statements of Operations.
61